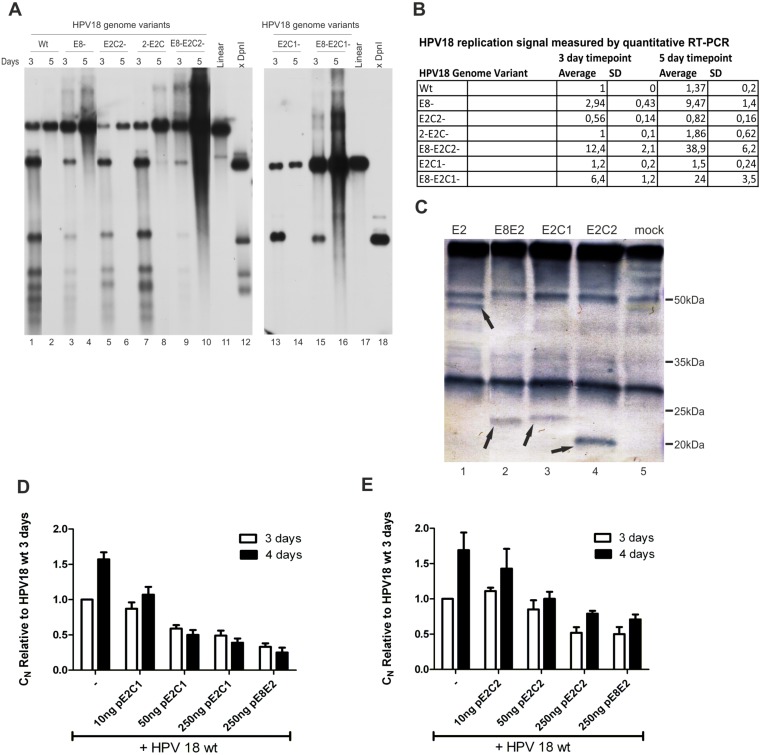
Figure 7. Mutational analysis of the functions of the putative E2C1 and E2C2 proteins expressed from promoter P3385.
A: Southern blot analysis of the transient replication of different HPV18 genome mutants. U2OS cells were transfected with 2 µg of HPV18 wt, E8-, E2C2-, 2-E2C-, E8-E2C2-, E8-2-E2C-, E2C-1 or E8-E2C1- minicircles. Genomic DNA was extracted 3 and 5 days after the transfection, linearized with BglI and treated with DpnI to distinguish between transfected and replicated DNA. The samples were analyzed by Southern blotting after hybridization with an HPV18-specific radiolabeled probe. Size markers for linearized HPV18 (lanes 11 and 17) and for the DpnI-digested fragments of the HPV18 (lanes 12 and 18) are included B: U2OS cells were transfected with 2 µg of the indicated HPV18 genome mutants, and genomic DNA was extracted 3 and 5 days after the transfection. Samples were digested with BglI and DpnI, and the replication of different HPV18 genome mutants was measured by a qPCR-based analysis of the viral relative copy number (CN). The value obtained from the HPV18 wt 3-day time point was set to 1, and the CN values of other samples are expressed relative to this point. The average and standard deviation (SD) of at least three independent experiments are shown. C: U2OS cells were transfected with the expression plasmids of HPV18 full-length E2, E8E2, E2C1 and E2C2. IP-Western Blot analyses was performed to evaluate the expression levels and MWs of different HPV18 E2 variants. Arrows indicate the positions of the full-length E2 (lane 1), E8∧E2 (lane 2), E2C1 (lane 3) and E2C2 (lane 4). Mock transfection is shown in lane 5. D and E: U2OS cells were transfected with 2 µg of HPV18 wt minicircle plasmid alone or together with different concentrations (10, 50 and 250 ng) of either the expression vector or the E2C-1 or E2C-2 proteins. The E8ˇE2 expression vector (250 ng) was added as a control. Genomic DNA was extracted 3 and 4 days after the transfection, linearized with BglI and treated with DpnI. A qPCR-based analysis of the viral relative copy number (CN) was performed. The value obtained from the HPV18 wt 3-day time point was set to 1, and the CN values of other samples are expressed relative to this point. Panel D shows the effect of overexpression of E2C-1 on HPV18 wt replication, whereas panel E shows the effect of E2C-2.

