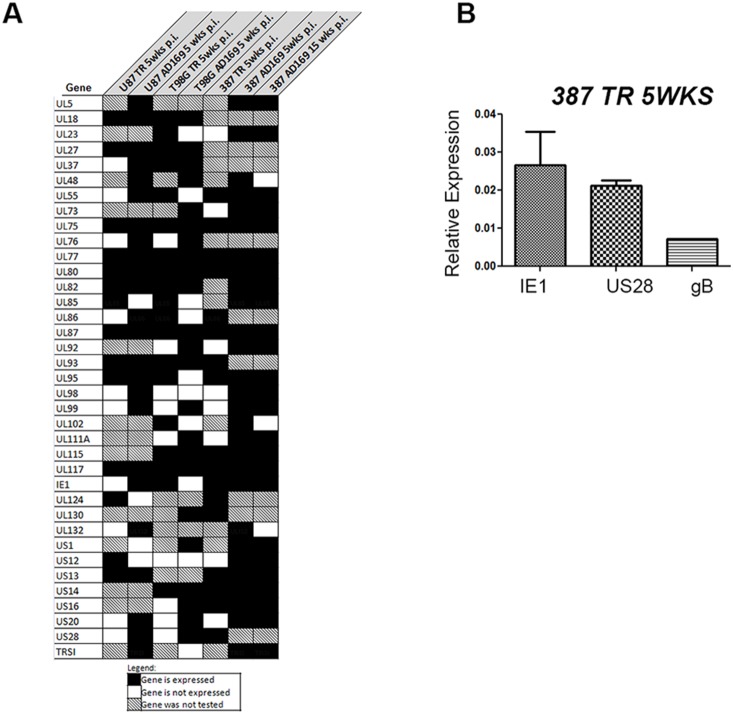
Figure 7. Graphic representation of HCMV gene expression at late time points in all cell lines and viral strains tested.
A. Viral genes with detectable expression at 5 wks p.i. and 5 wks p.i. + IL-6 (also 15 wks p.i. and 15 wks p.i. + IL-6 for AD169-infected 387 cells) across U87, T98G, and 387 GSC are shown. A square with striped background indicates that the gene was not tested for that particular sample. B. Taqman validation for IE1, US28, and gB gene expression in GSC 387 infected with TR (5 weeks p.i). Mean values normalized to Rab14 are shown. Samples were run in triplicate. Error bars are displayed.

