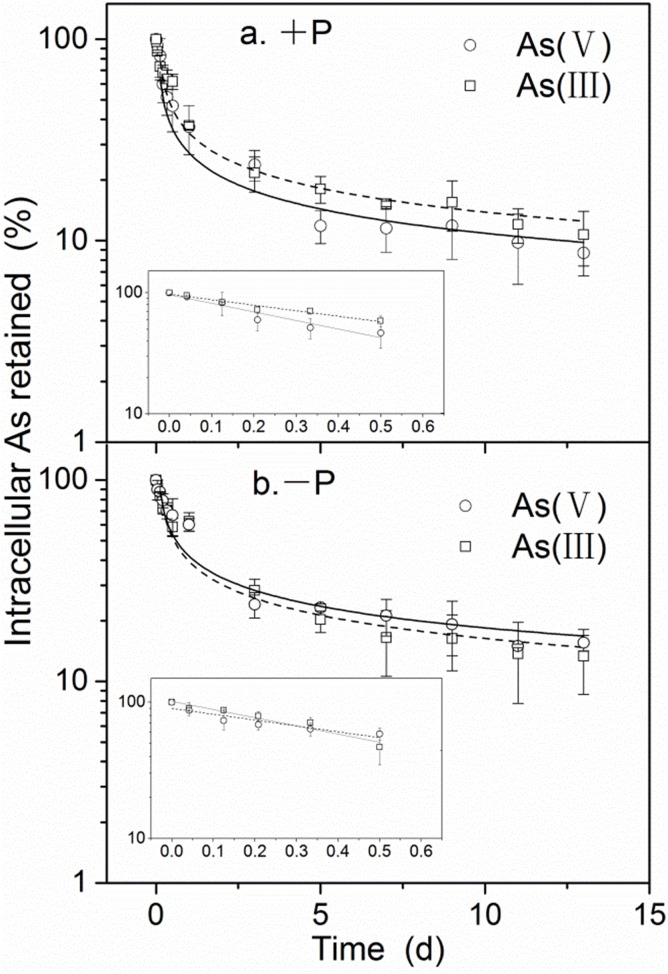
Figure 2. Proportional arsenic loss from M. aeruginosa after 24 h arsenate or arsenite exposure under the different phosphate regimes employed.
Each symbol denotes arsenic concentration (from which background concentrations were subtracted) as a percentage of the intracellular concentration at 0 d (means ± SD, n = 3). Arsenic loss over a period of 13 d after a period of 24 h individual exposure to 10 µM arsenate and arsenite under +P or −P treatments is shown in (a) and (b), respectively (arsenic loss over 12 h is shown in the corresponding embedded box).

