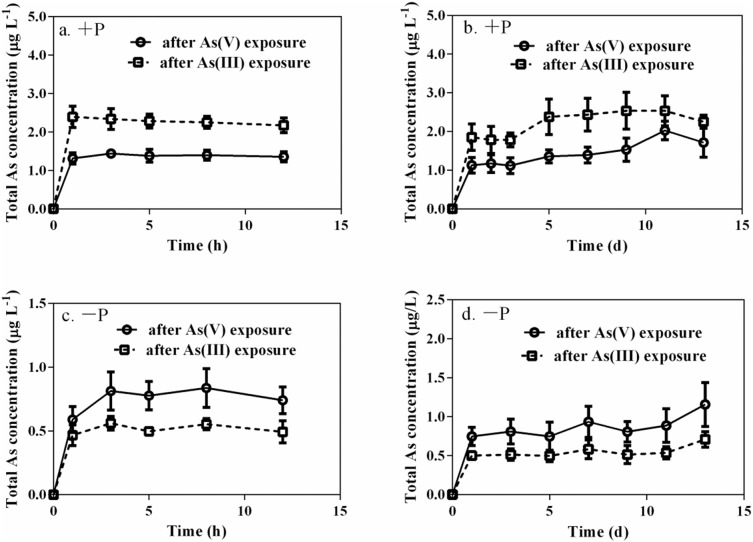
Figure 4. Total arsenic concentrations in solutions for the limited (12 h) and extended (13 d) depuration periods after 24 h individual 10 µM arsenate and arsenite pre-exposures.
(a) and (b) represent +P treatments while (c) and (d) represent −P treatments. Each point is represented as means ± SD (n = 3).

