
Figure 2. Analysis of hubs and nodes with highest communicability.
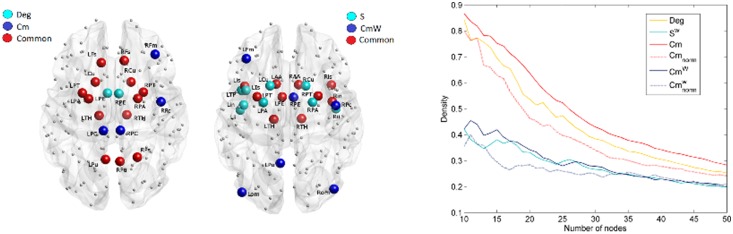
A) maps of the nodes with highest Deg and/or Cm. B) maps of nodes with highest Sw and/or Cmw (normalized). The metric values for the nodes represented are at least one standard deviation (SD) over the average value. C) Density variation among the nodes with highest Deg, Cm, Sw, Cmw.