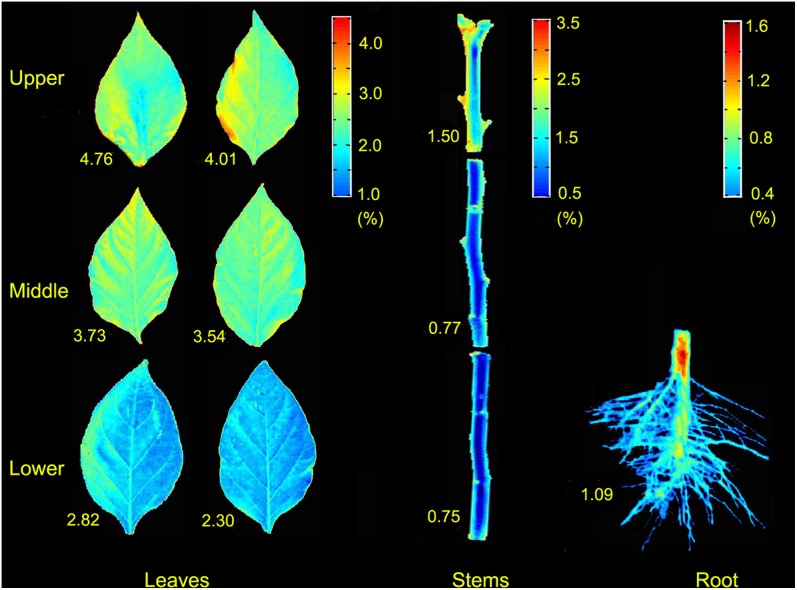
Figure 5. Spatial distribution maps of TNCs-HSI in samples of an exemplary tested pepper plant included six leaves, three stems, and one root, respectively.
TNCs-HSI of samples in hyperspectral images were computed based on linear function (2) and TNCs-HSI distribution was achieved in MATLAB software. The numbers accompanying each sample map denote the respective TNC-DC value.

