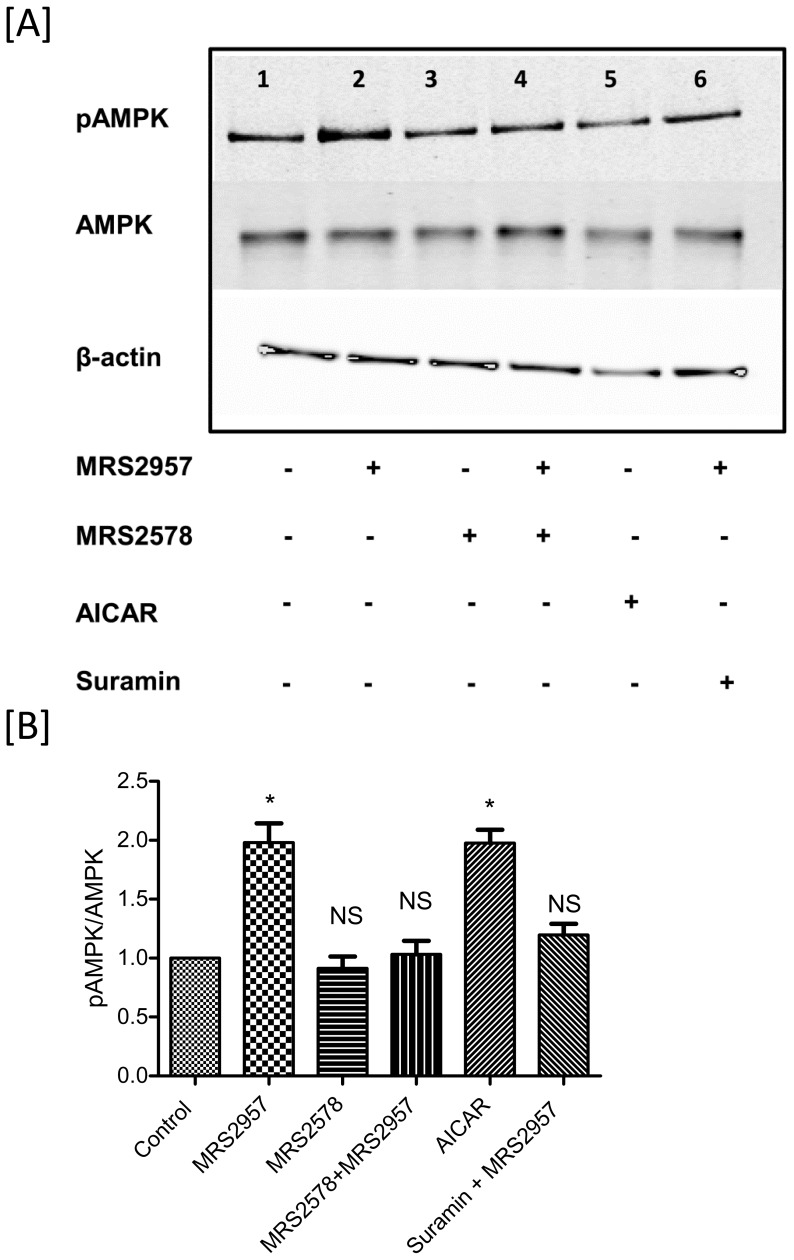
Figure 6. Phosphorylation of AMPK in 3T3-L1 adipocytes (A and B) after treatment with MRS2957.
This is a representative blot from three individual experiments. The density of the bands were quantified and compared to the controls (B and D). *P<0.05, when compared to controls, NS, non-significant when compared to controls (n = 3). Lane 1, Control, 2, MRS2957 (100 nM), 3, MRS2578(1 µM), 4, MRS2578+ MRS2957, 5, AICAR (200 µM), 6, Suramin (20 µM)+MRS2957.

