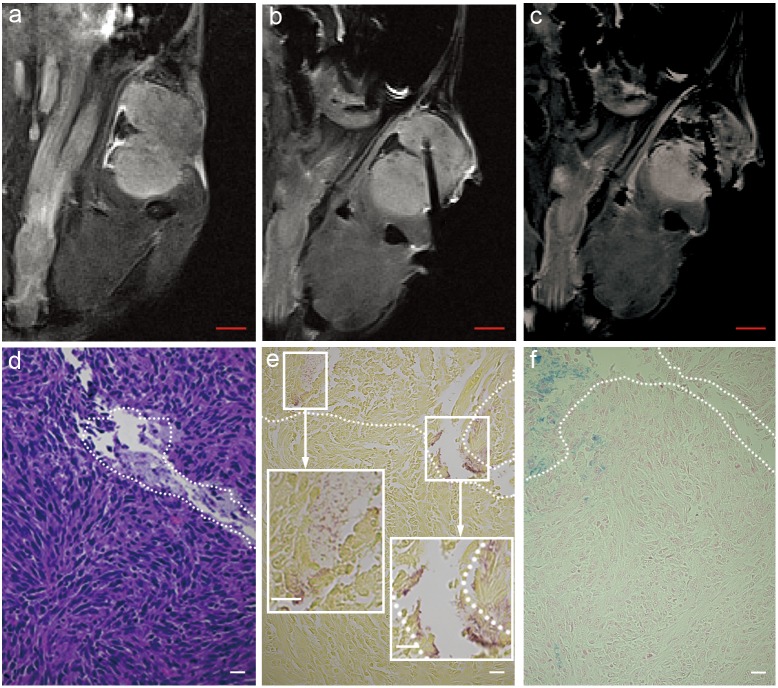
Figure 4. MRI-monitored injection of iron-oxide labeled C.novyi-NT into Panc02 tumors in mouse pancreatic cancer model.
Coronal T2*-weighted image of tumor pre-injection and prior to injection catheter placement (a), after catheter placement within the tumor (b), and post-injection of iron-oxide labeled C.novyi-NT (c). Hematoxylin-eosin (HE) staining of tumor specimen (d) and both Gram staining and Prussian blue staining from adjacent sections shown in (e) and (f), respectively. The white dashed zones in (d-f) depict the catheter tract and distal zones of iron-oxide labeled anaerobe deposition. Size bar for MRI image a, b and c = 2 mm. Scale bar within d, e, f, insets of e = 20 µm.

