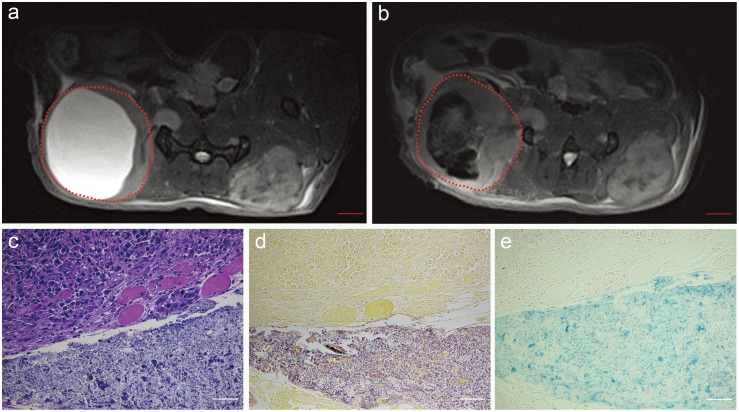
Figure 5. MRI measurements following percutaneous injection of iron-oxide labeled C.novyi-NT into a Panc02 tumor with an expansive central zone of liquefactive necrosis.
Axial T2*-weighted images acquired pre-injection (a) and immediately post-injection (b). The red dashed zones in (a) and (b) indicate the tumor position. Hematoxylin-eosin (HE) staining (c), Gram staining (d) and Prussian blue staining (e) from tissue sample at border between solid viable tumor and necrotic region depict the broad distribution of the iron-oxide labeled anaerobes with the necrotic zones. Size bar for MRI image a and b = 2 mm. Scale bars within c, d and e = 50 µm.

