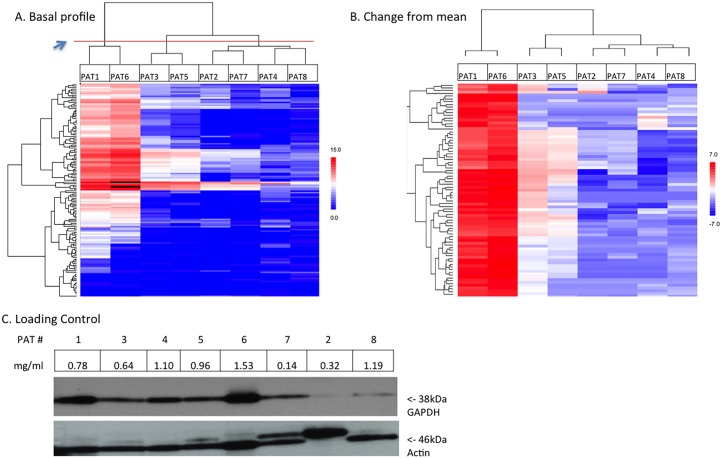
Figure 4. Basal kinomic activity profiles.
Unsupervised hierarchical clustering of basal (untreated) tyrosine kinomic profiles displaying log transformed slope-exposure for (A) all 144 peptides and (B) as change from sample mean and filtered for variance >1. Red in (A) indicates relative increased signal and in (B) indicates an increase from sample mean. Blue indicates the opposite. Blue arrowhead points to red line denoting dendrogram separation. (C) Western blotting of GAPDH and Actin is shown with sample concentration indicated for each patient.

