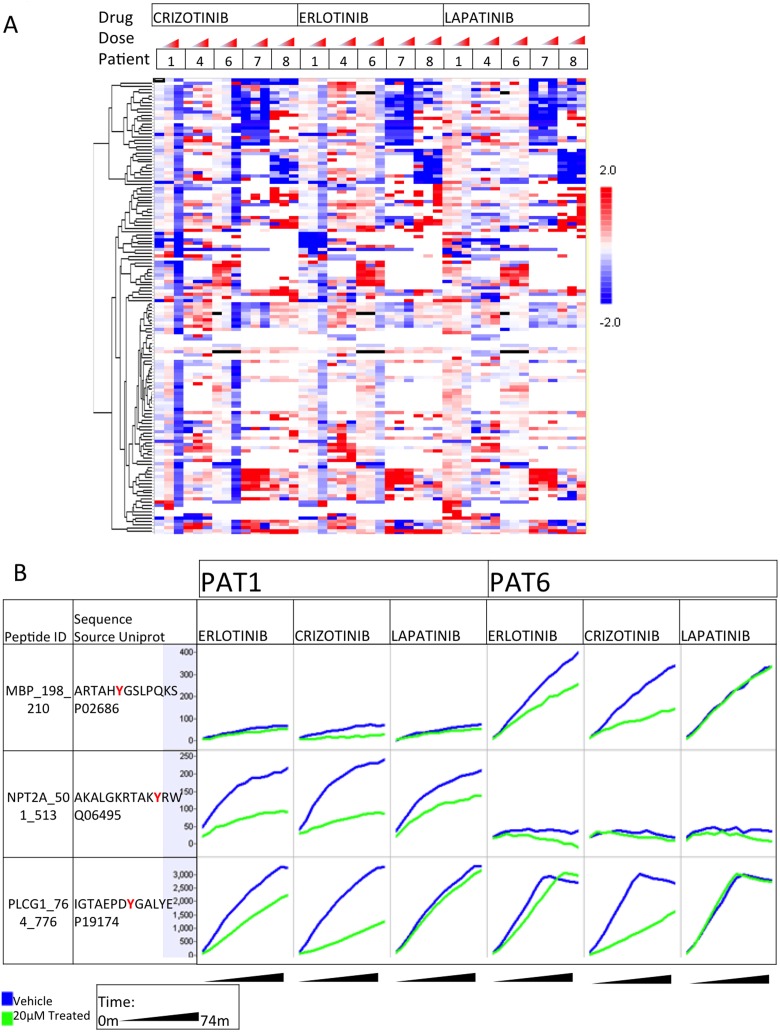
Figure 5. Ex vivo drug response profile.
Displays ex vivo drug response profiles as (A) a heatmap of kinase activity (log signal values) change from untreated, clustered by row, of altered phosphopeptides per patient, per dose at 20 nM, 0.5 µM or 20 µM. (B) Ex vivo prewash kinetic peptide phosphorylation (y axis per cell) over time (x axis per cell) of selected peptides in the selected samples, in response to indicated drugs at 20 µM. Blue lines denote untreated, and green lines indicate treated phosphorylation curves.

