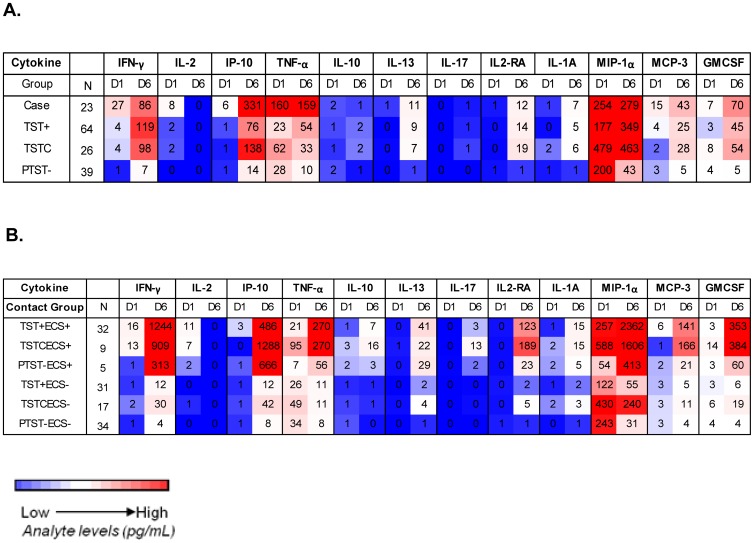
Figure 2. Cytokine/chemokine responses in TB cases and household contacts stratified by TST status after stimulation with ESAT-6/CFP-10 (EC) at enrolment.
Following overnight or 6 day culture of peripheral blood mononuclear cells with EC, supernatants were collected and multiplex cytokine assays performed. Geometric mean levels are shown (pg/ml) A: Heat map showing geometric mean levels of different analytes after overnight (D1) versus 6 day (D6) culture in cases and contacts based on TST phenotype. The highest geometric means are shaded in red and the lowest in blue. Contacts were categorized according to TST scores at baseline and 6 months: TST+ = TST positive: TST≥10 mm at baseline; TSTC = TST converters: TST<10 mm at baseline and TST≥10 mm plus an increase in induration of at least 6 mm by 6 month; PTST−: persistently TST negative: TST<10 mm at both time–points. B: Heat map showing geometric mean levels of different analytes after overnight (D1) and 6 day (D6) culture in contacts grouped according to TST status and baseline EC IFN−γ ELISPOT (ECS) results. The highest geometric means are shaded in red and the lowest in blue.

