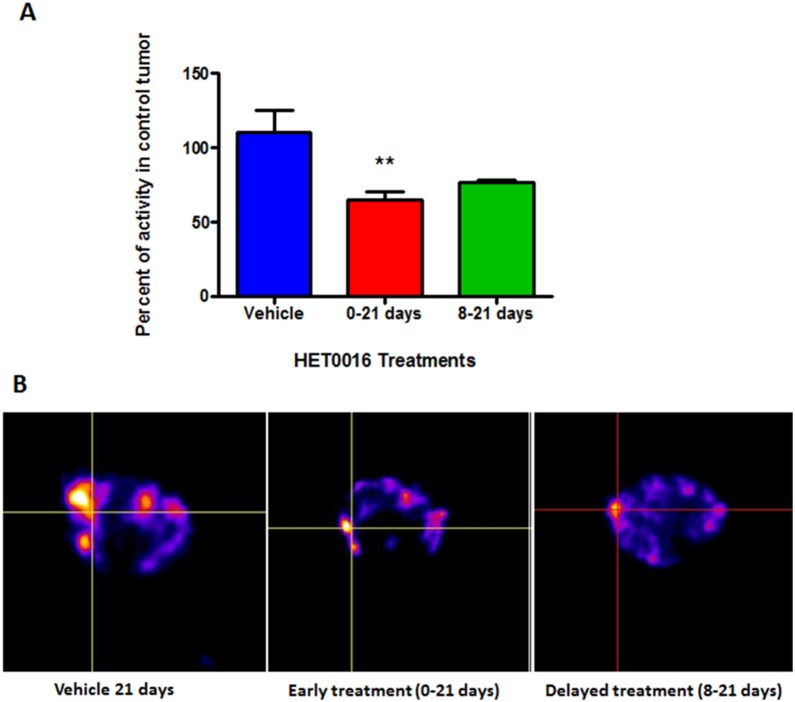
Figure 2. SPECT analysis of in vivo accumulation of Tc-99m-HYNIC-VEGF-c.
One hour after injection, SPECT images were obtained using dedicated animal scanner. A) Semi-quantitative analysis of total radioactivity in the tumors normalized to corresponding control tumors showing the intensity of radioactivity in the vehicle and HET0016 treated groups. B) Images of vehicle treated mice showed increased accumulation of Tc-99m-HYNIC-VEGF-c compared to that HET0016 treatment groups (early and delayed). Intersection of lines indicates the tumor. Error bars: ± standard error, **p = 0.0131.

