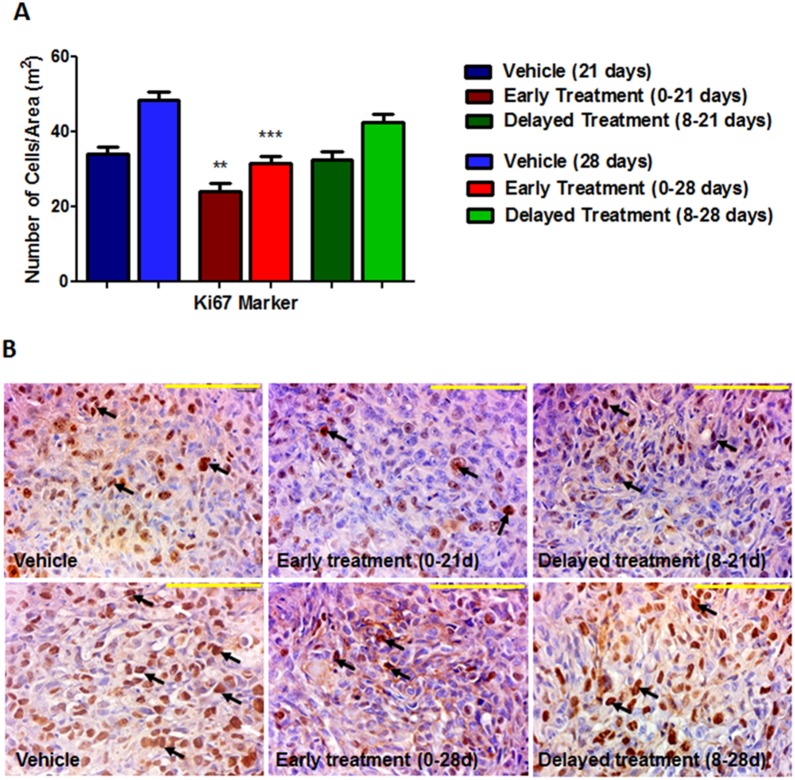
Figure 4. Immunohistochemistry stained with Ki-67 in vehicle and HET0016 treated tumors groups.
A) Quantitative estimation of cell proliferation showing number of cells per area (m2). B) Top images were taken from tumor of 21 days and bottom images were taken from tumor of 28 days. The arrows shows cellular nucleus stained. Error bars: ± standard error, **p<0.001. Scale bar = 100 µm.

