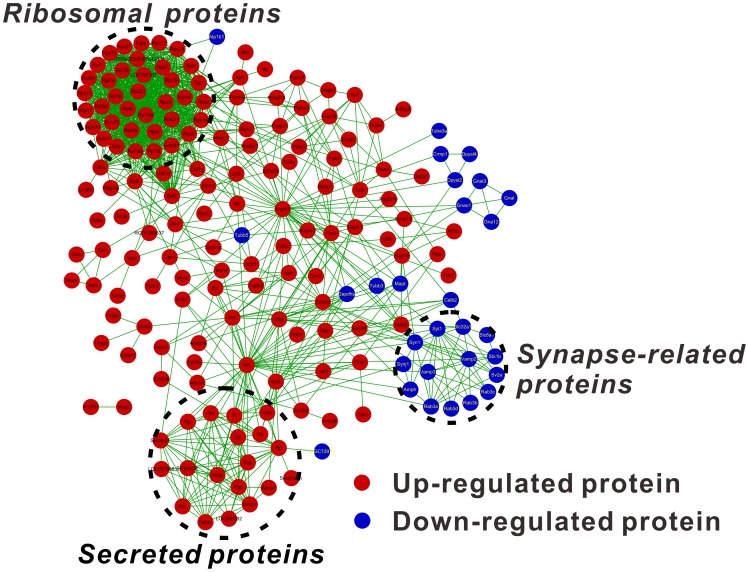
Figure 2. The protein-protein interaction network of the changed proteins reveals a ribosomal, a secreted and a synapse-related protein cluster.
The up- or down-regulated proteins were submitted for network analysis using STRING. The obtained proteins and ‘interactions’ were then imported into Cytoscape for data visualization. Only the interactions above a medium confidence level, as defined by STRING (>0.400), are presented.

