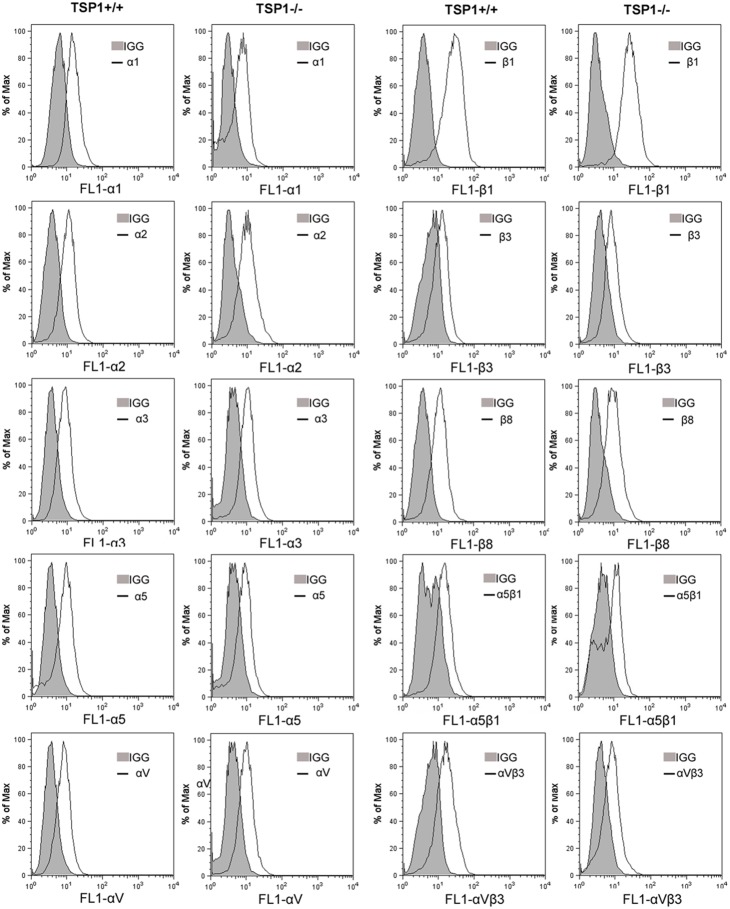
Figure 6. Expression of integrins in ChEC.
α1-, α2-, α3-, α5-, αv-, β1-, β3-, and β8-integrin expression of ChEC was determined by FACS analysis as described in Methods. The shaded graphs show staining in the presence of control IgG. Please note the similar expression for α1-, α2-, α3-, α5-, αv-, β1-, β3-, and β8-integrin in TSP1+/+ and TSP1−/− ChEC. The levels of α5β1- and αvβ3-integrin were decreased in TSP1−/− ChEC. These experiments were repeated with two different isolations of cells with similar results.

