
Fig. 1.
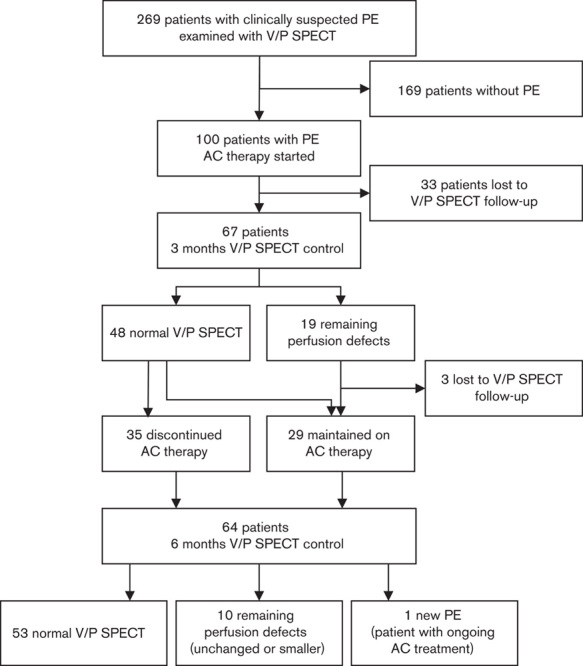
Flow chart illustrating the number of patients in the study, results from V/P SPECT follow-up examinations and AC therapy duration. AC, anticoagulant; PE, pulmonary embolism; V/P SPECT, ventilation/perfusion single-photon emission computed tomography.