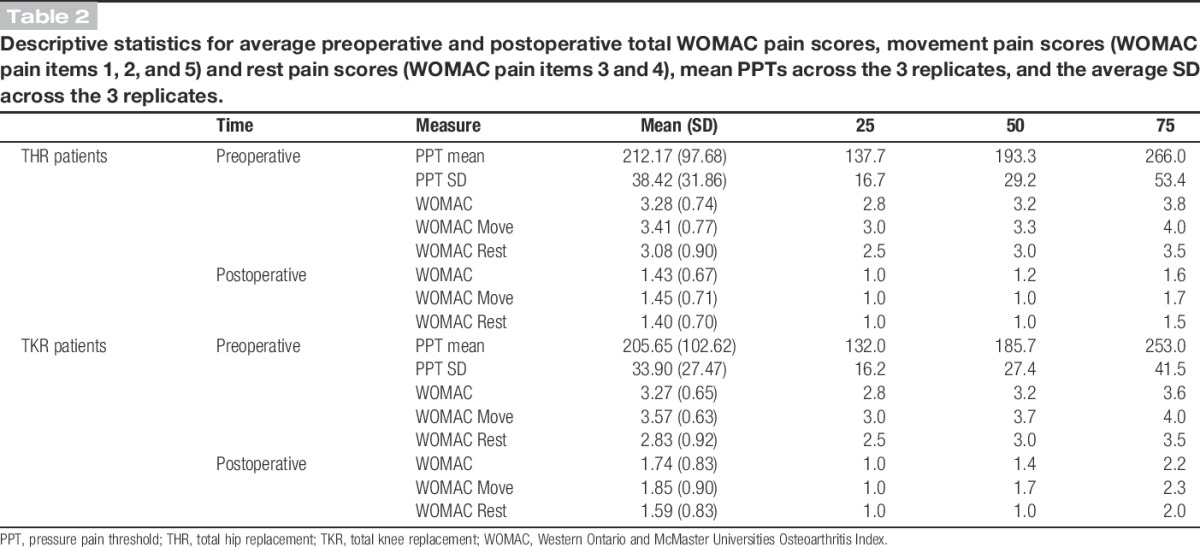
Table 2.
Descriptive statistics for average preoperative and postoperative total WOMAC pain scores, movement pain scores (WOMAC pain items 1, 2, and 5) and rest pain scores (WOMAC pain items 3 and 4), mean PPTs across the 3 replicates, and the average SD across the 3 replicates.