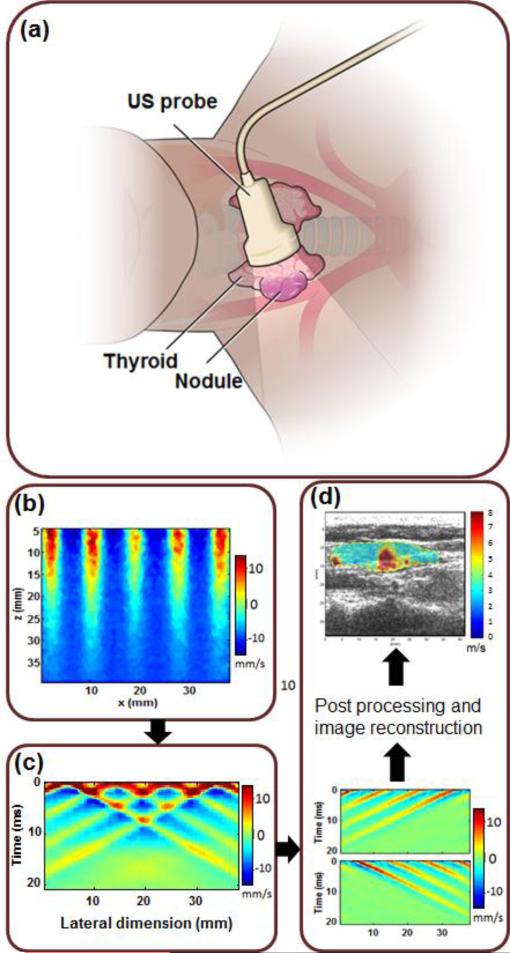
Fig. 1.
US/CUSE imaging diagram. (a) In vivo US/CUSE thyroid nodule imaging. (b) An example of comb-push ARF excitation of the medium. The colors indicate the particle velocity at the time of application of comb-push ARF. (c) Shear wave generated in response to the comb-push excitation. The colors represent the particle velocity and thus indicate the propagation of generated shear waves. (d) CUSE processing showing separation of the LR and RL waves by means of directional filters, post-processing, image formation and basic image processing to provide the shear wave speed map of a region of interest (ROI) including a thyroid nodule and its surrounding background.

