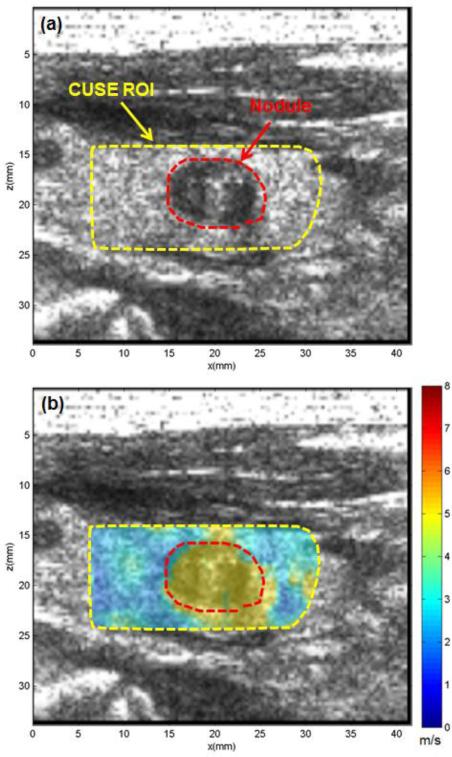
Fig. 5.
US and CUSE shear wave speed map of thyroid tissue with a benign nodule. (a) B-mode US image showing CUSE ROI (dashed yellow contour) and the nodule (red dashed contour). (b) CUSE shear wave speed map. The nodule is clearly visualized with a higher shear wave speed. Both B-mode US and CUSE images were acquired in longitudinal planes.

