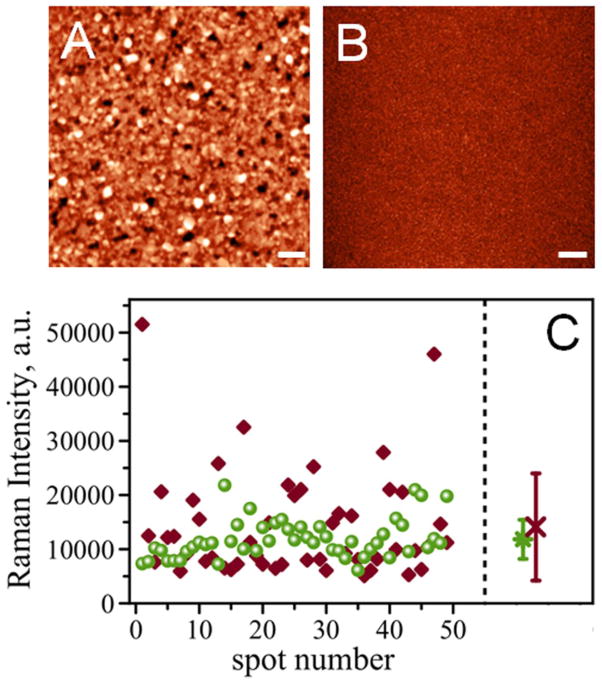
Figure 3.
AFM topography of template-stripped gold surfaces using (A) silicon wafer as a template and (B) mica as template with the same z-scale. Scale bar is 1 μm. (C) comparison of Raman intensities for gold surfaces stripped from silicon wafer (diamonds) and mica based (circles) measured as a map of 7 by 7 spectra on a 50 μm area. Right panel: averaged RI for silicon (at 14100 counts, red cross) and mica (at 11800 counts, green circle); corresponding standard deviation values are shown as error bars.

