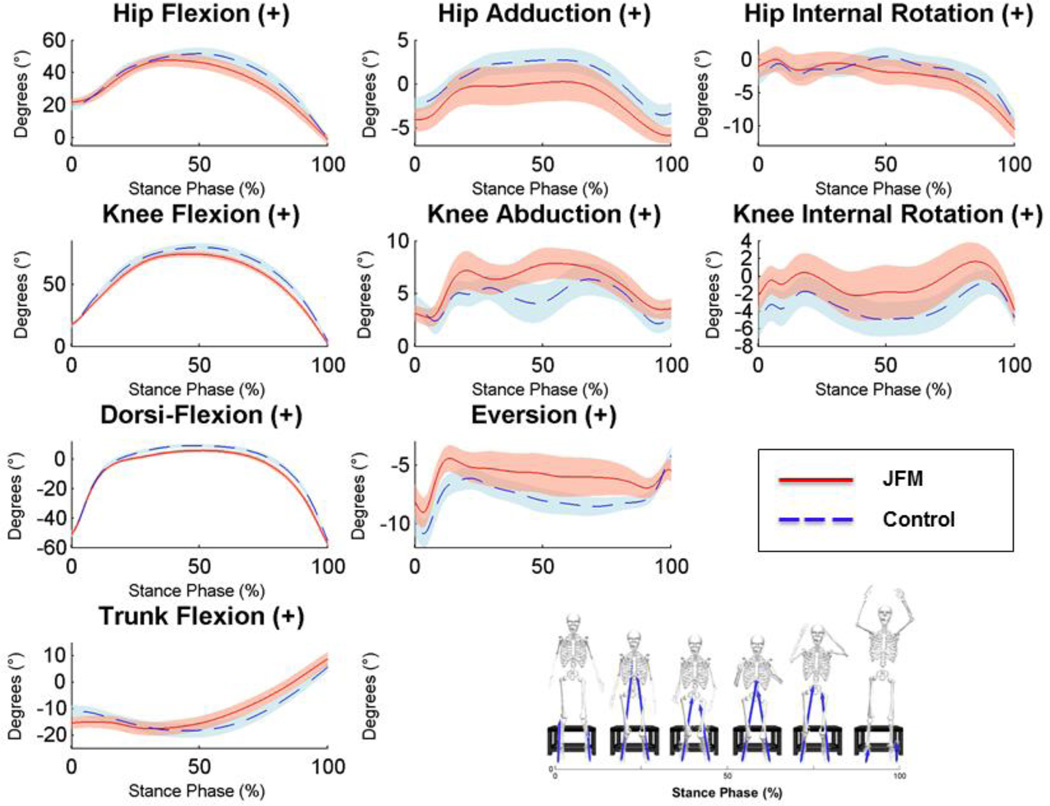
Figure 4.
Time-series plots of kinematic variables collected during the stance phase of the drop vertical jump.
Solid/dashed lines represent mean performance and the surrounding shaded areas illustrate the (+/−) standard error for patients with JFM (depicted in pink) and healthy controls (in blue). Non-overlapping standard errors represent significant group differences. The left column displays angular motion in the sagittal plane at the hip, knee, ankle, and the trunk, respectively, from top to bottom. The middle column displays angular motion in the coronal plane, and the right column displays angular motion in the transverse plane. Hip, Knee, and Dorsi-Flexion can be visualized as a bend in each joint, reducing the angle between the long bones of the lower extremities. Hip Adduction is illustrated as the thigh moves toward the midline of the body. Knee Abduction can be visualized as the knee joint moves toward the midline of the body in a “knock-kneed” position. Eversion of the foot occurs when the foot rotates toward the midline of the body, in a more flat-footed position. Hip and Knee Internal Rotation can be visualized as a twisting of the joint in the direction of the midline of the body. Trunk Flexion is a reduction in the angle of the torso relative to the pelvis.

