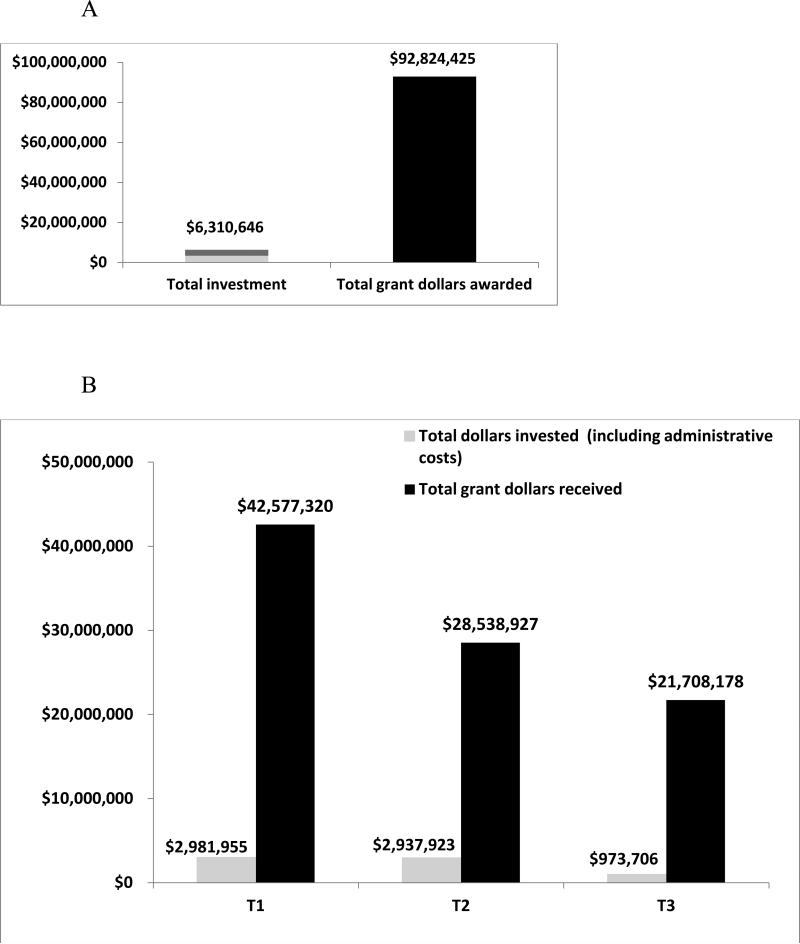
Figure 1.
A graph depicting (A) the return on investment (ROI) from May 2008 to June 2014 for 2008 to 2013 Project Development Team (PDT) funded projects; ROI was greater than $14 for every $1 invested, including pilot funding and PDT members’ salaries; and (B) the overall total dollars invested in PDT projects, including administrative costs and the total return on investment in grant dollars represented by translational phase (See Table 1 for translational phase descriptions)

