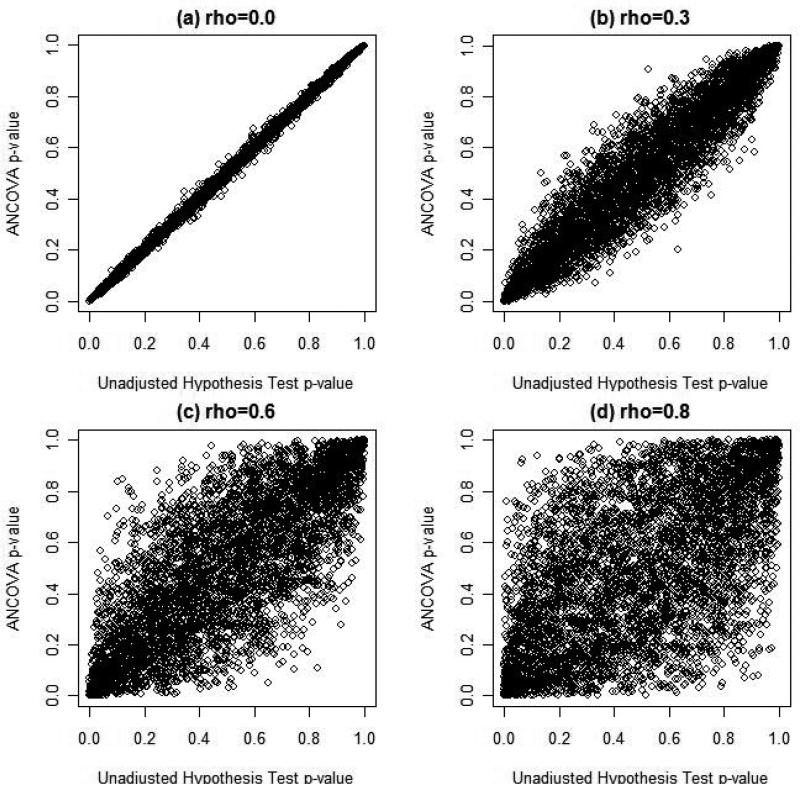
Figure 3. Relationship between AMCOVA and Unadjustment Hyposthesis Tests, N = 1000.
Figure 3 illustrates the relationship between ANCOVA and the standard unadjusted test for treatment effect using the p-values for each test. In each of the plots illustrated, there was no simulated treatment effect and thus the p-values for each type of analysis should be uniformly distributed on (0,1). When there is no association between the covariate and outcome, there is almost perfect correlation between the two tests' p-values (Pearson's r = 0.999). As figure 3 illustrates, as the level of correlation between the covariate and the outcome increases, the strength of the association between the two types of statistical analyses diminishes. Figure 3(d) suggests relatively weak and noisy association between the two statistical tests when the covariate X is strongly associated with outcome Y. Thus, it is not surprising

