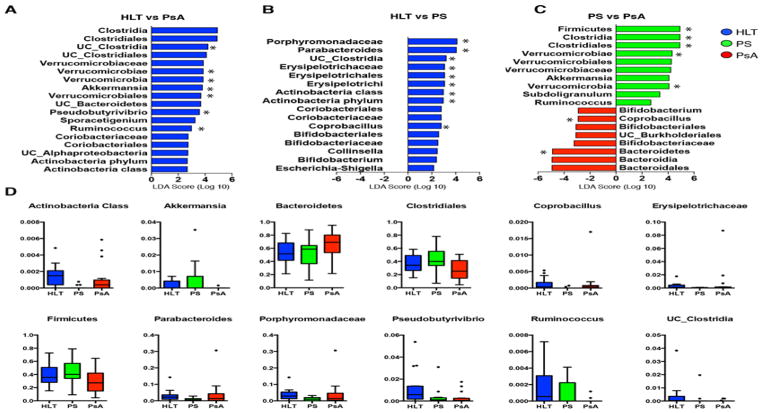
Figure 1. Bacterial taxa differences between PsA, Ps and healthy controls.
Bacterial taxa significantly enriched in healthy controls (HLT) as compared to psoriatic arthritis (PsA) patients were detected by LefSe (P <0.05, LDA >2logs) and after false-discovery rate (FDR). (A) Overall, no taxon was found to be enriched in PsA (red bars) compared to HLT (blue bars) or (B) Ps patients (green bars). Taxa are arranged in descending order according to their LDA score and marked with an asterisk (*) when significance remained after FDR correction. (C) Taxa differentiating PsA from Ps samples. (D) Box-plots with relative abundance (parts per unit) of specific taxa underrepresented in PsA and Ps subjects. Only those with statistical differences after FDR correction are shown.

