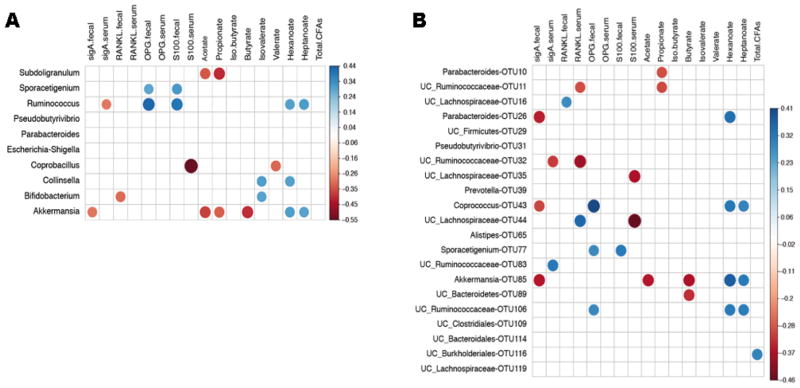
Figure 5. Correlations between gut microbiota and metadata.

Relative abundance of gut microbiota was correlated with levels of various proteins and fatty acids in serum and/or fecal samples. Heatmaps showing correlations between patient metadata and intestinal microbiota at (A) genus level or (B) OTU level. Circle sizes and color intensity represent magnitude of correlation. Blue circles = positive correlations; red circles = negative correlations.
