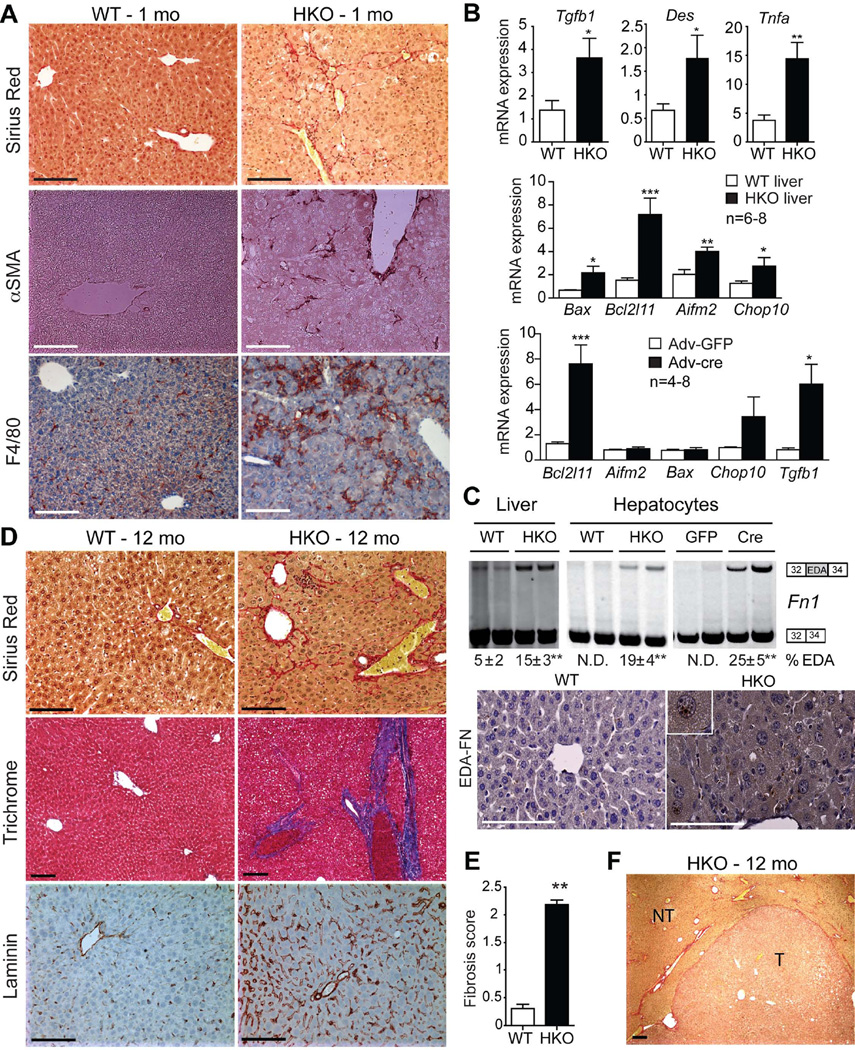
Fig. 3. Deletion of SRSF3 causes liver fibrosis.
(A) Representative sections from young livers (1 mo) stained for fibrosis (Sirius Red), myofibroblast activation (αSMA) and macrophage infiltration (F4/80), n=8/genotype. (B) Expression of Tgfb1, desmin (Des), Tnfa, and the apoptotic regulators Bax, Bcl2l11, Aifm2 and Chop10 in WT and HKO liver at 1 month by Q-PCR, n=6–8/group. Gene expression after Adv-cre or Adv-GFP infection of Srsf3:floxed hepatocytes, n = 4–8/group. (C). Representative gels showing Fn1 splicing in liver or hepatocytes from 1 month WT and HKO mice, or after Adv-cre or Adv-GFP infection of Srsf3:floxed hepatocytes, with the mean percentage of EDA exon inclusion ± SEM shown below, n=8/group. Photographs show liver sections at 1 month stained for EDA-FN. (D) Sirius Red and Trichrome staining for fibrosis (red and blue, respectively), and laminin staining (brown) in WT and HKO livers at 12 mo. (E) Mean fibrosis score from evaluation of histopathology from multiple liver sections at 12 months. (F) Sirius Red staining (5X) for fibrosis in HKO tumor at 12 months. T and NT indicate tumor and non-tumor areas.

