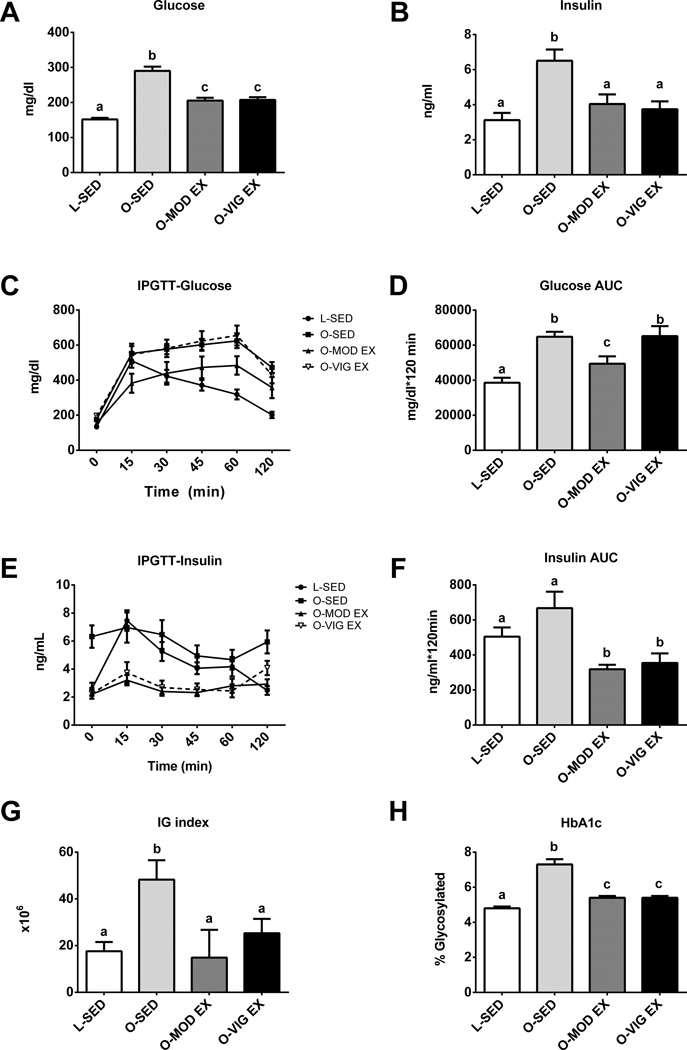
Figure 1.
Moderate and vigorous exercise-induced alterations in glycemic control. Fasting glucose (A), fasting insulin (B), post-glucose challenge glucose curves (C), glucose area under the curve (D), post-glucose challenge insulin curves (E), insulin area under the curve (F), IG index (G), and hemoglobin A1c (HbA1c; H). Values (n=6–10 per group, means ± SE) with different letter superscripts are significantly different (p<0.05).

