Fig. 2.
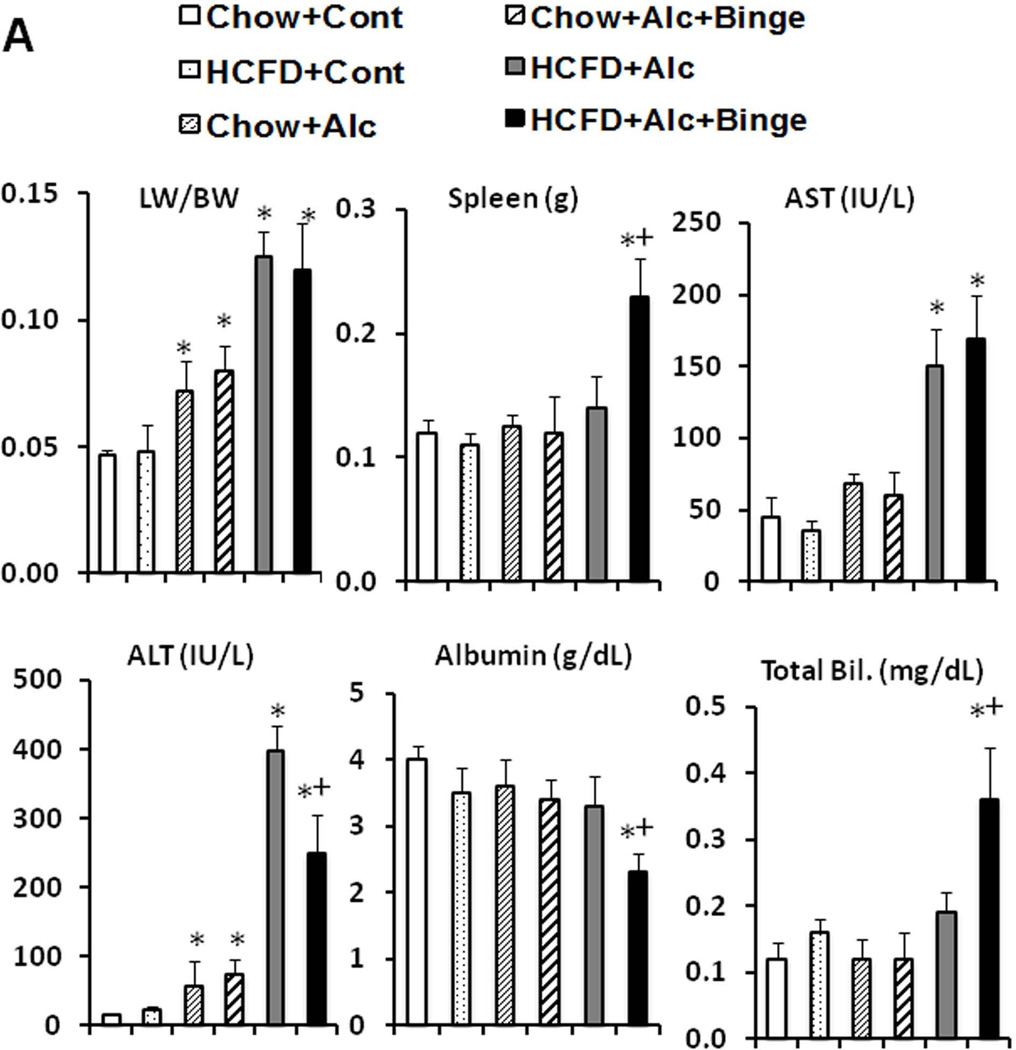
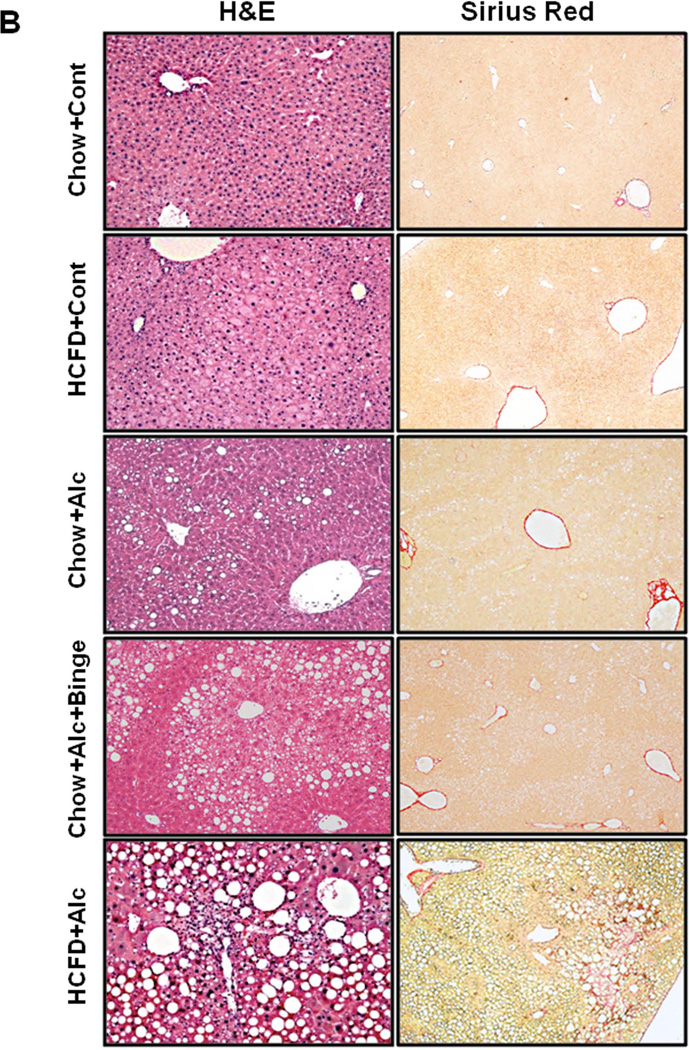
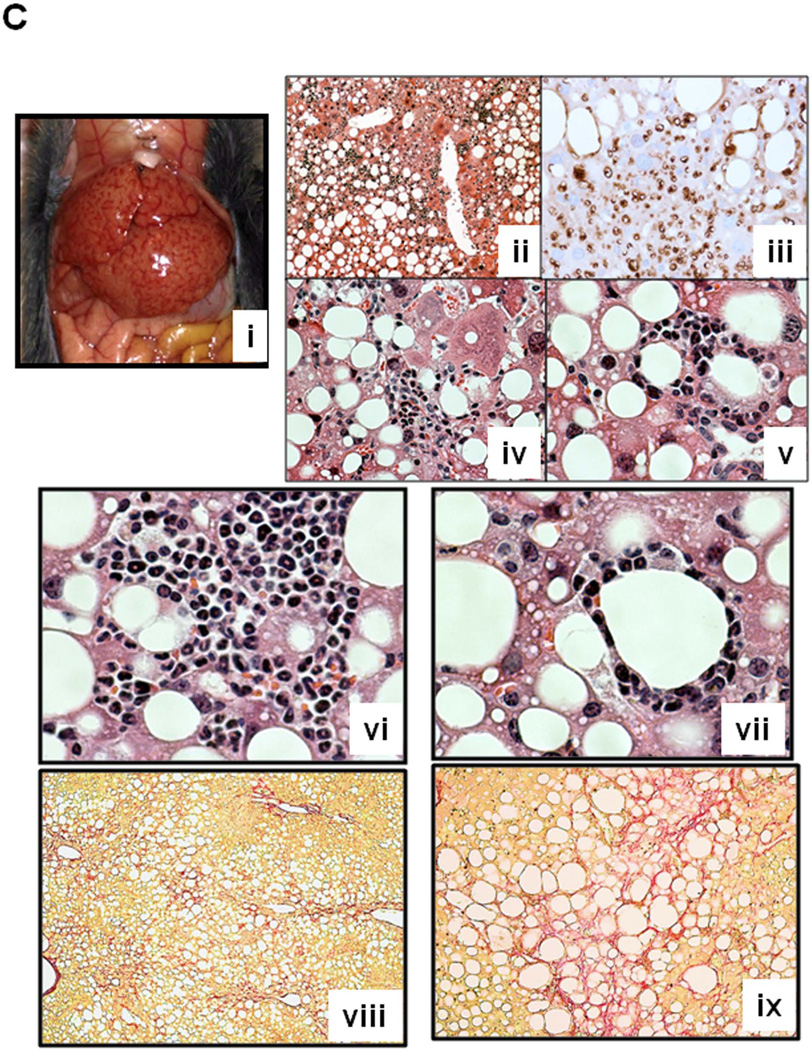
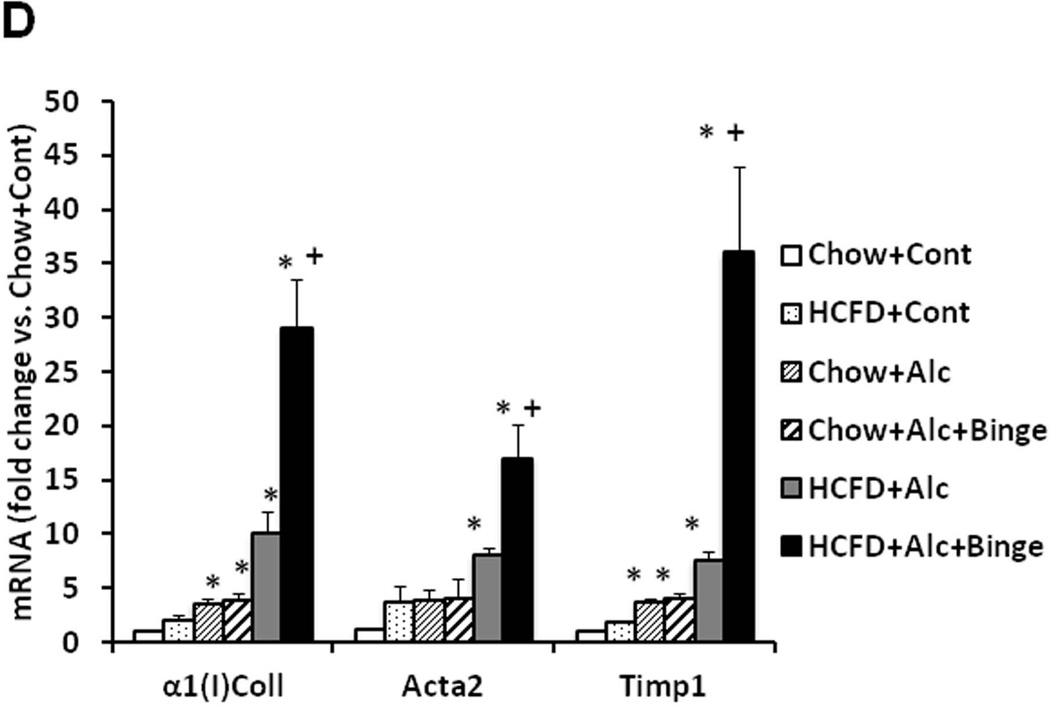
A. Synergistic increases in the liver weight/body weight and plasma ALT and AST levels are noted in HCFD+Alc and HCFD+Alc+Binge mice. Splenomegaly, hypoalbuminemia, and hyperbilirubinemia are noted only in HCFD+Alc+Binge mice. *p<0.05 compared to Chow+Cont; +p<0.05 compared to HCFD+Alc. B. Representative lower power images of the liver stained with H&E and Sirius red. ASH with mononuclear cell inflammation and liver fibrosis is noted in the HCFD+Alc mouse. x100 magnification. C. A representative gross photo of the markedly enlarged and inflamed HCFD+Alc+Binge mouse liver (i). Diffuse and intense PMN parenchymal infiltration in the HCFD+Alc+Binge mice, ×100 (ii). Chloracetate esterase (CEA) staining confirms PMNs infiltrating into the liver parenchyma, ×200 (iii). PMN infiltration often surrounds necrotic or degenerating foamy hepatocytes, ×200 and ×400 (iv and v). Massive PMN infiltration with necrotic hepatoyctes, ×400 (vi). PMN encircling a degenerative hepatocyte forming “satellitosis”, ×600 (vii). Sirius red staining demonstrates pericellular and perisinusoidal liver fibrosis, ×100 and ×200 (viii and ix). D. Fibrogenic genes, 1(I)Coll, Sma (Acta2), and Timp1 are induced in HCFD+Alc and further upregulated in HCFD+Alc+Binge livers. *p<0.05 compared to Chow+Cont; +p<0.05 compared to HCFD+Alc.


