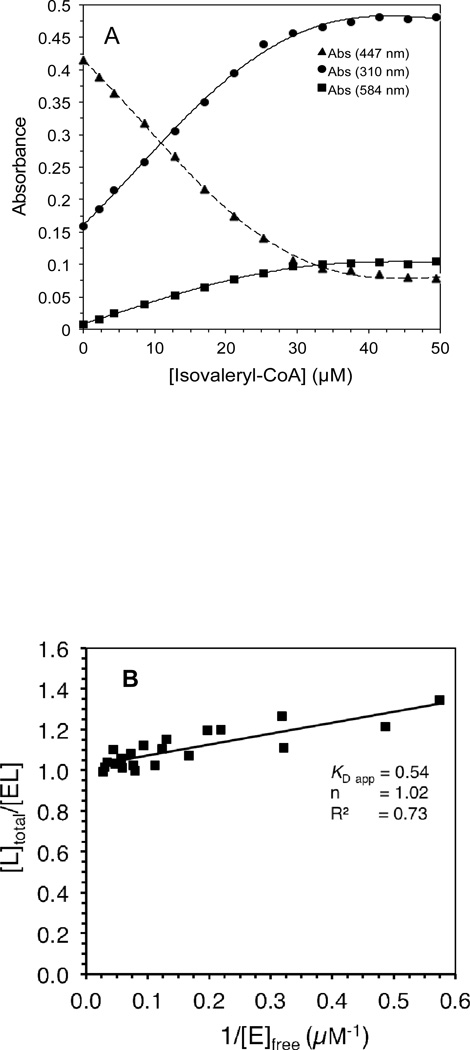
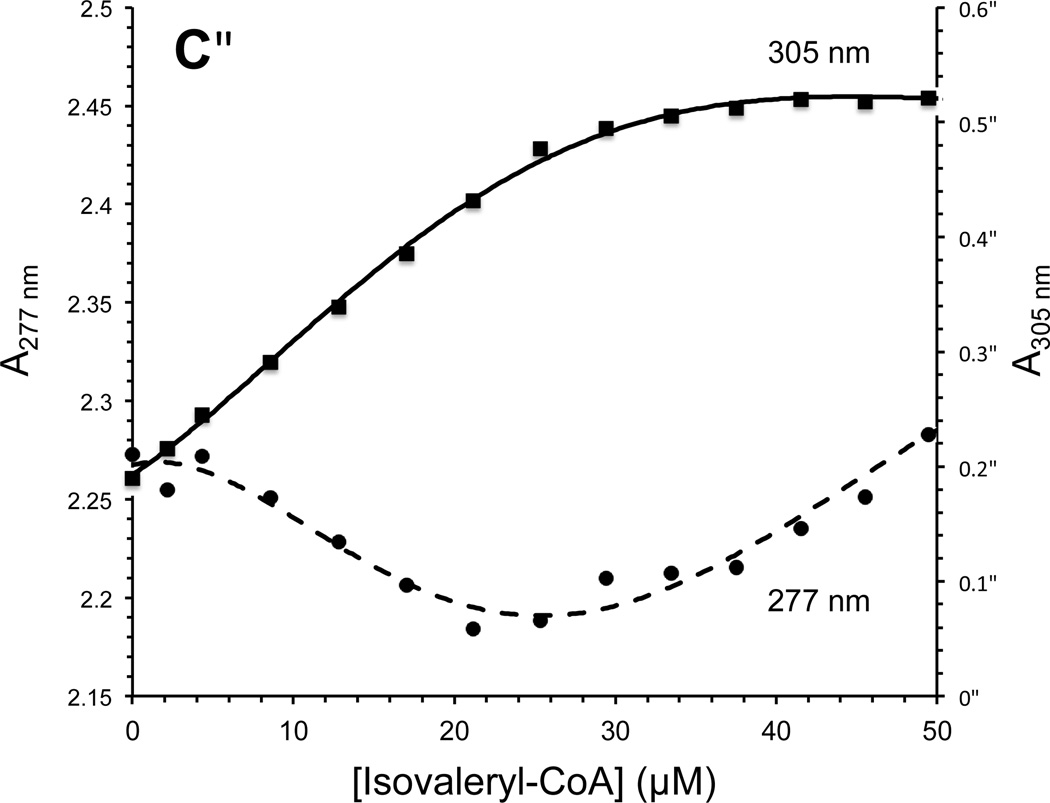
Figure 4.
Effect of adding increasing amounts of isovaleryl-CoA on IVD absorbance at specific wavelengths: (A) decrease of absorbance at 447 nm, solid triangle, and increase of absorbance at 584 nm, solid square. (B) Stockell plot derivative of the absorbance data, at 447 nm, from three separate titrations. The extrapolated Y intercept represents the number of active sites per monomer, and the slope represents the KD app, the apparent binding constant, see Materials and Methods. E represents one subunit and L is the ligand, isovaleryl–CoA. (C) Changes in absorbance at indicated wavelengths induced by addition of 4.3, 8.6, 12.8, 17.0, 21.2, 25.3, 29.4, 33.5, 37.5, 45.5, and 49.5 µM isovaleryl-CoA.


