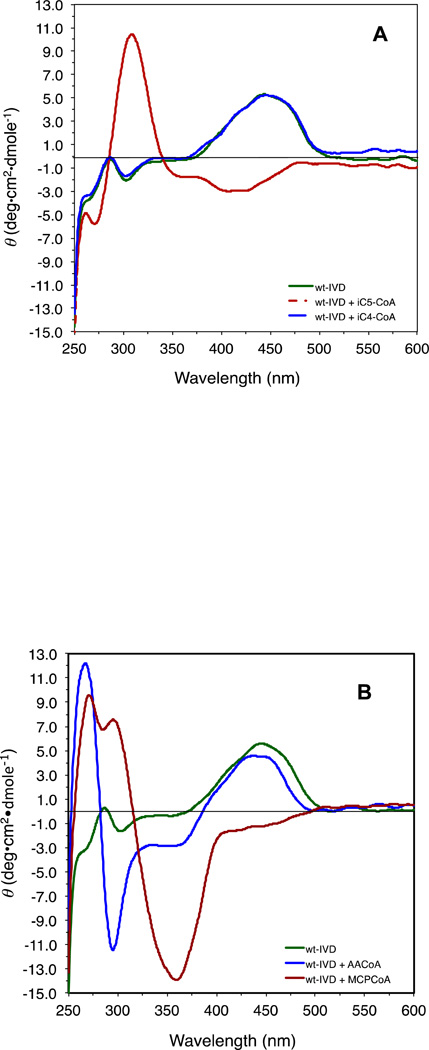
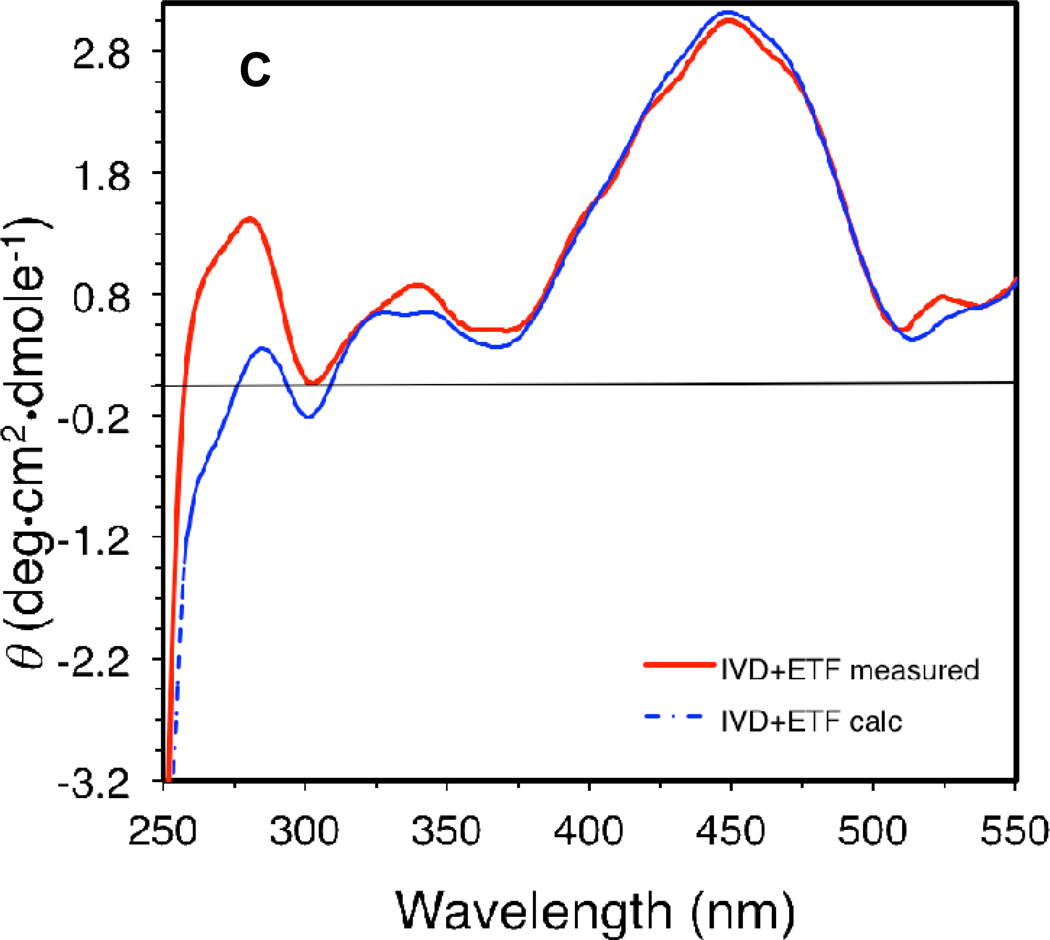
Figure 7.
Effect of the presence of ligands on the CD spectrum of IVD: (A) CD scan of recombinant human IVD (10 µM) in the absence of ligands (green line) and presence of ten molar fold isovaleryl-CoA (red line), or isobutyryl-CoA (blue line), under anaerobic conditions. (B) CD spectrum scans of recombinant human IVD in the absence of ligands (green line) and presence of ten molar fold acetoacetyl-CoA (blue line), and MCPCoA (red line). (C) Difference CD scan of a 2:1 molar ratio mixture of recombinant human IVD monomer (11 µM) and porcine ETF heterodimer, respectively; blue line is for the spectrum of the mixture, and the red line is the calculated sum of IVD and ETF scanned separately and adjusted for dilution. All CD scans were performed in 50 mM potassium phosphate, pH 8.0, at ambient temperature.


