
Table 2.
Comparison of cognitive test results among the 3 groups
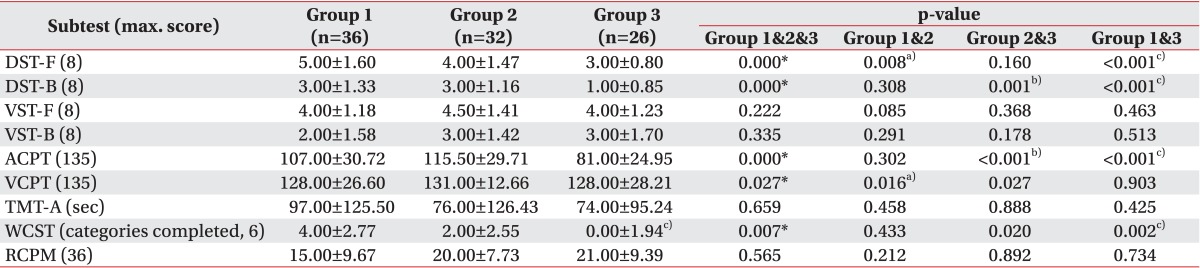
Values are presented as mean±standard deviation.
DST-F, digit span test forward; DST-B, digit span test backward; VST-F, visual span test forward; VST-B, visual span test backward; ACPT, auditory continuous performance test; VCPT, visual continuous performance test; TMT-A, Trail Making Test type A; WCST, Wisconsin card sorting test; RCPM, Raven colored progressive matrices.
a)Statistically significant (p<0.017) difference between group 1 and group 2 by Mann-Whitney test with Bonferroni correction.
b)Statistically significant (p<0.017) difference between group 2 and group 3 by Mann-Whitney test with Bonferroni correction.
c)Statistically significant (p<0.017) difference between group 1 and group 3 by Mann-Whitney test with Bonferroni correction.
*p<0.05 by Kruskal-Wallis test.