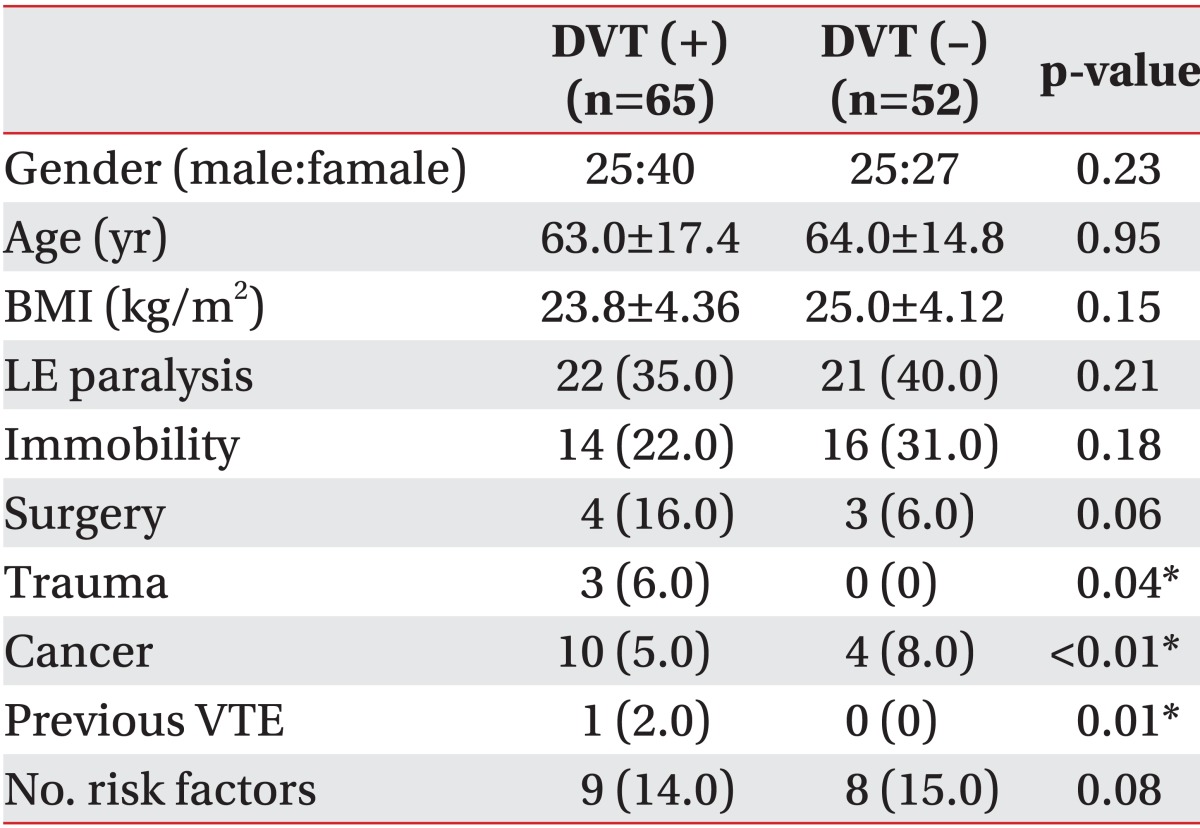
Table 2.
Comparisons of clinical characteristics and risk factors in patients with DVT and without DVT

Values are presented as mean±standard deviation or number (%).
DVT, deep vein thrombosis; BMI, body mass index; LE paralysis, lower extremity paralysis including hemiplegia, paraplegia, and tetraplegia; VTE, venous thromboembolism.
*p<0.05, significant differences exists between DVT group and no DVT group.
