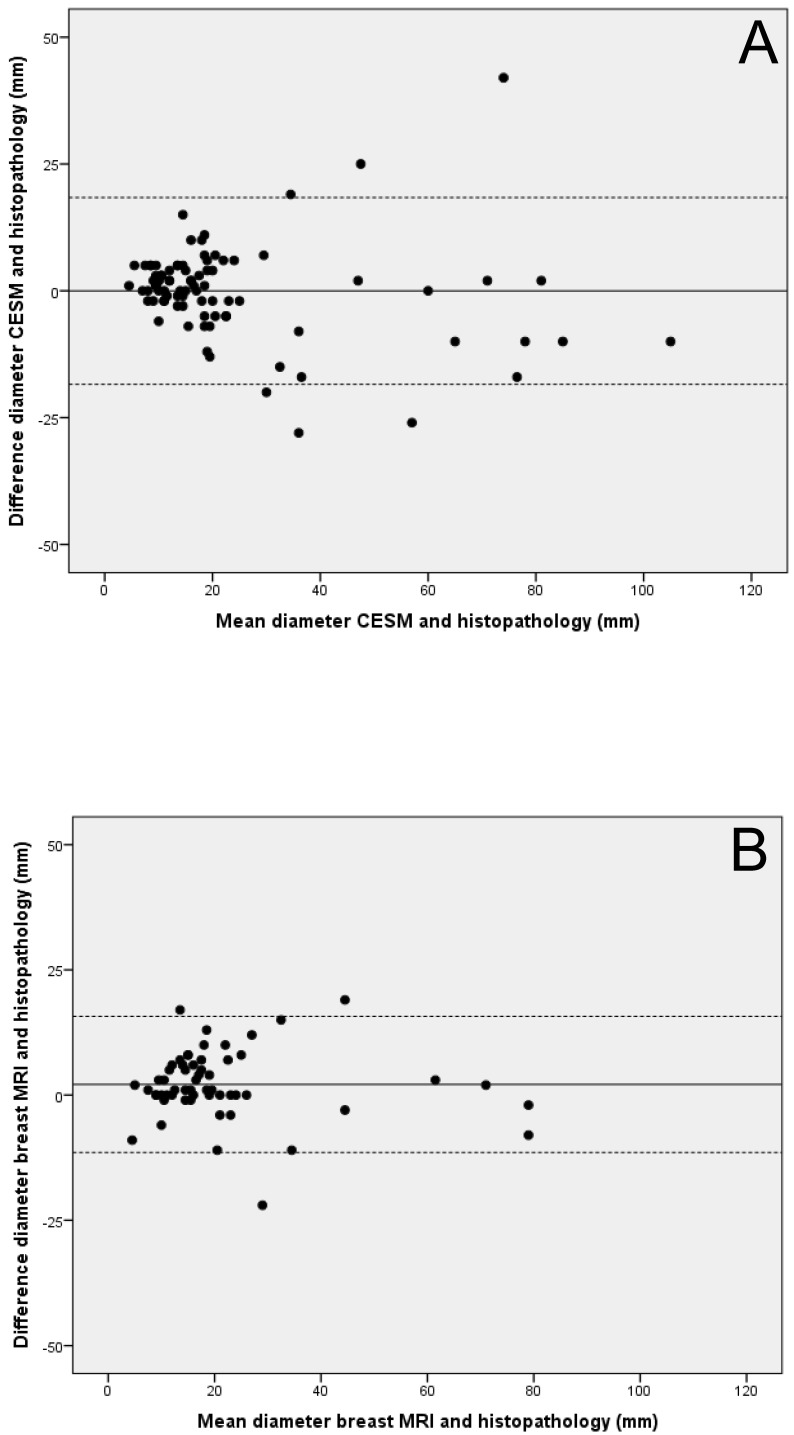
Figure 3.
Bland-Altman plots for the comparison between (A) CESM and histopathology and (B) breast MRI and histopathology. Continuous lines represent the mean of the differences between measurements, the dotted lines represent upper and lower limits of 1.96 times the standard deviations of differences.

