
Figure 2.
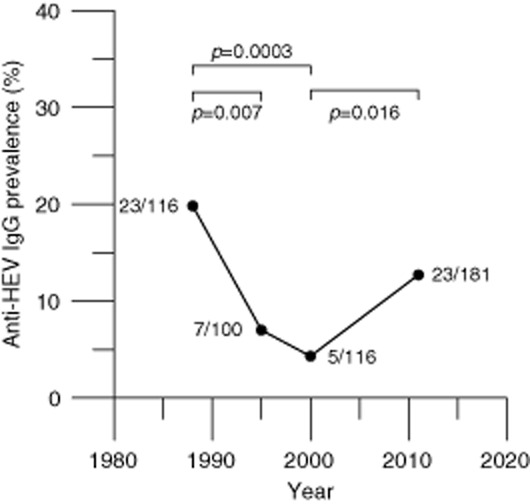
Anti-HEV IgG seroprevalence among donors aged 18 to 21 in 1988, 1995, 2000, and 2011. The total number of samples and the number of anti-HEV–positive samples are indicated for each time point. The numbers above the bars denote the two-sided p values calculated using the chi-square method.