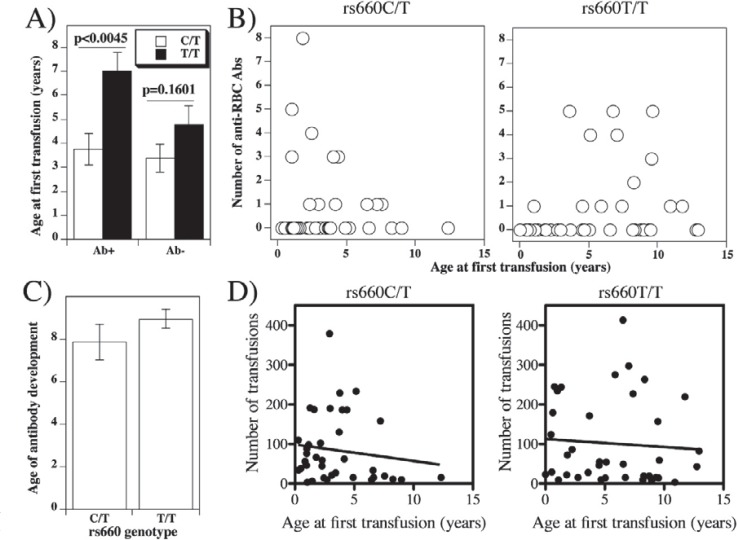
Fig. 2.
Anti-RBC antibody production as a function of patient age at first transfusion. A Average age (± SE) of antibody positive or negative patients with rs660C/T or rs660T/T genotype when they received first transfusion. B The number of distinct anti-RBC antibodies detected in each patient in the function of the age at first transfusion of individual SCD patients with C/T (left) or T/T (right) genotype.C Average age (±SE) of patients with rs660C/T or rs660T/T genotype when individual antibodies were detected (differences are not significant; p = 0.3615). D Correlation between age at first transfusion with total number of transfusions in patients with rs660C/T or rs660T/T genotype. Correlation coefficients were: r = 0.1364 for rs660C/T and r = 0.0712 for rs660T/T patients (not significant in either case). Best-fit straight lines were obtained by linear regression analysis and are represented by the following formulas: y = −23.7 −4.17x (rs660C/T) and y = 55.73 – 2.021x for rs660T/T. Deviations from zero were not significant (p = 0.414 for rs660C/T and p = 0.671 for rs660T/T genotype. Mean numbers of total transfusions received were 84.29 ± 13.92 for rs660C/T and 101.2 ± 17.47 for rs660T/T (p = 0.451).

