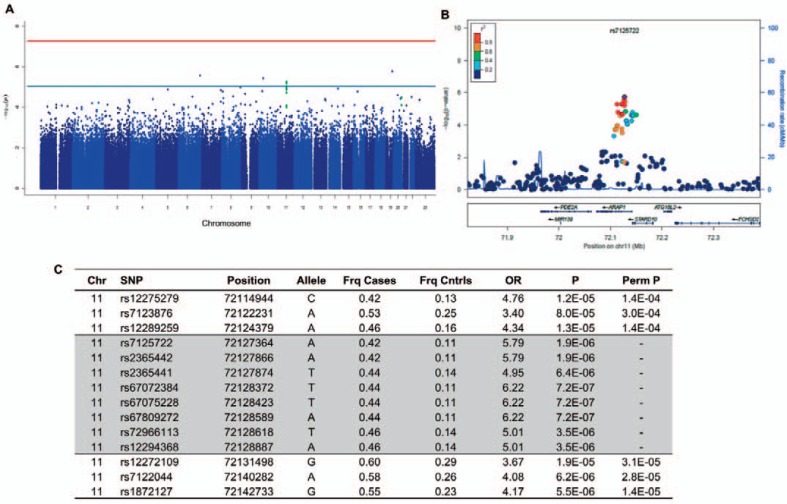
Fig. 3.
Case control GWAS of responder status. A Manhattan plot showing no SNPs below genome-wide significance (red line, p = 0.5 × 10⁻⁸), but suggestive SNPs (blue line, p = 1 × 10⁻⁴) in the ARAP1/STARD10 gene region (green dots). B Local Manhattan plot of 250 kb region around ARAP1/ STARD10 including genotyped and imputed SNPs. Pairwise LD (r2) is derived from the HapMap YRI population. C GWAS results for genotyped and imputed (shaded) SNPs in the ARAP1/STARD10 region. OR = Odds ratio; Perm P = permuted p value.

