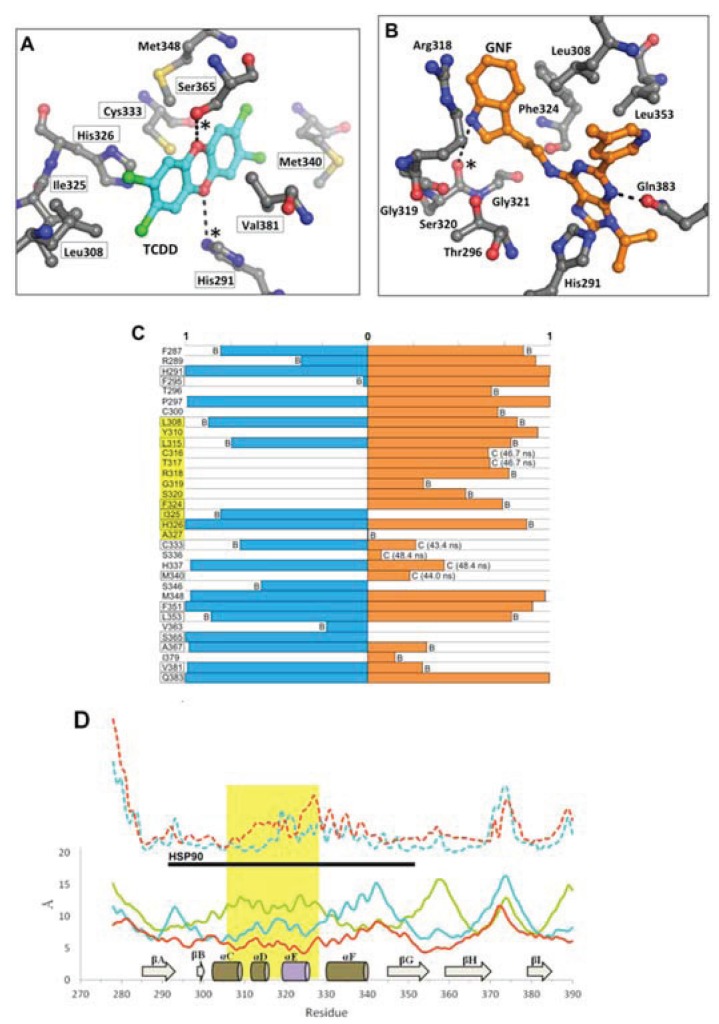
Figure 11.
Environment and interactions of the bound ligands. (A) The environment of the ligand-binding cavity is shown for the equilibrated agonistMD model (at 50 ns) colored by atom: carbon, grey; oxygen, red; nitrogen, blue; sulfur, yellow. TCDD is depicted with sticks (with carbon atoms colored in cyan); active site residues that form transient hydrogen bonds with the buried polar groups of the ligand are noted with (*). The important interacting residues of the bound TCDD are shown, and residues which have been investigated via mutagenesis and found to influence TCDD binding are noted in black boxes [13,18]. (B) As in panel A, the active site cavity is shown for the equilibrated antagonistMD model (at 50 ns). (C) Residues contacting the ligand (within 4 Å) during the final 10 ns of simulation are shown with the percentage of contact time noted for agonistMD (blue) and antagonistMD (orange). For those with less than 90% contact time over the final 10 ns, we note whether this is due to fluctuation from being on the pocket boundary (denoted with “B”) or due to a conformational shift (denoted with “C”), for which we also note the time of occurrence. (D) Shown is a plot of root mean square fluctuation of Cα atoms to illustrate structural dynamics for apoMD (solid green) agonistMD (solid cyan), antagonistMD (solid orange) as calculated by VMD [33] during the last 5 ns of simulation. The Cα shifts between apoMD and agonistMD (dashed cyan) and between apoMD and antagonistMD (dashed orange) are also shown on the same scale, but for clarity their values are adjusted +20 Å. The 307–329 segment is highlighted in gold, with the secondary structure of the apoMD given for reference, and the regions interacting with HSP90 in the murine system are noted by the black bar.

