
Figure 6.

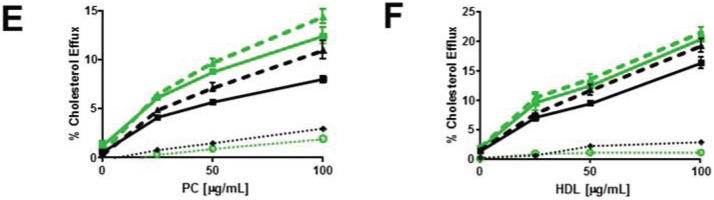
Myriocin reduces PM SM content and increases non-SM-associated cellular cholesterol pools and cholesterol efflux. (A) Myriocin reduces PM SM content. Control and ABCG1 cells pre-treated without myriocin ((−) MYR), or, with myriocin ((+) MYR) were immunostained with lysenin. (B) Myriocin increases cellular FC. Control and ABCG1 cells treated without ((−) MYR), or, with ((+) MYR) were stained with filipin. (C) Myriocin enhances CD-mediated PM FC efflux. Control (black line) and ABCG1 (green line) cells labeled with 3H-FC were pre-treated without or with myr (solid and dashed lines, respectively), and the percent of total cellular FC efflux CD (1 h at 4 °C) was determined. (D) Myriocin enhances CD-mediated cellular FC efflux. Control (black) and ABCG1 (green) cells labeled with 3H-FC were pre-treated without or with myr (solid and dashed lines, respectively), and the percent of total cellular FC efflux to CD (10 min at 37 °C) was determined. Myriocin enhances FC efflux to PC liposomes (E) and to HDL (F). (E, F): Black line, dashed black line: untreated, and myr-treated control cells, respectively; green line, dashed green line: untreated, and myr-treated ABCG1 cells, respectively. Dotted black and green lines represent difference curves for control and ABCG1 cells with myriocin treatment, respectively. All values are expressed as mean ± S.D. Data shown is representative of at least three replicate experiments. Two-way ANOVA analyses using multiple comparisons revealed that in (C), all values are significantly different (p < 0.0001). In (D) all values are significantly different, except for control cells treated with myriocin (black dashed line) vs. ABCG1 cells treated with myriocin (green dashed line) at 5 and 10 mM CD (p >0.9999 and p = 0.9940, respectively). In (E), all values are significantly different (p < 0.0001) except for control cells (black solid line) vs. control cells treated with myriocin (black dashed line) at 25 µg/mL PC (p = 0.5727) and, ABCG1 cells (green solid line) vs. ABCG1 cells treated with myriocin (green dashed line) at 25 and 50 µg/mL PC liposomes (p = 0.9998 and p = 0.3189, respectively). In (F), all values for untreated control cells (solid black line) are significantly different from untreated ABCG1 cells (solid green line), p < 0.0001. The values for percent cholesterol efflux did not significantly differ at 25, 50 or, 100 µg/mL HDL for myriocin-treated control cells (dashed black line) vs. ABCG1 cells (solid green line) or myriocin-treated ABCG1 cells (dashed green line).