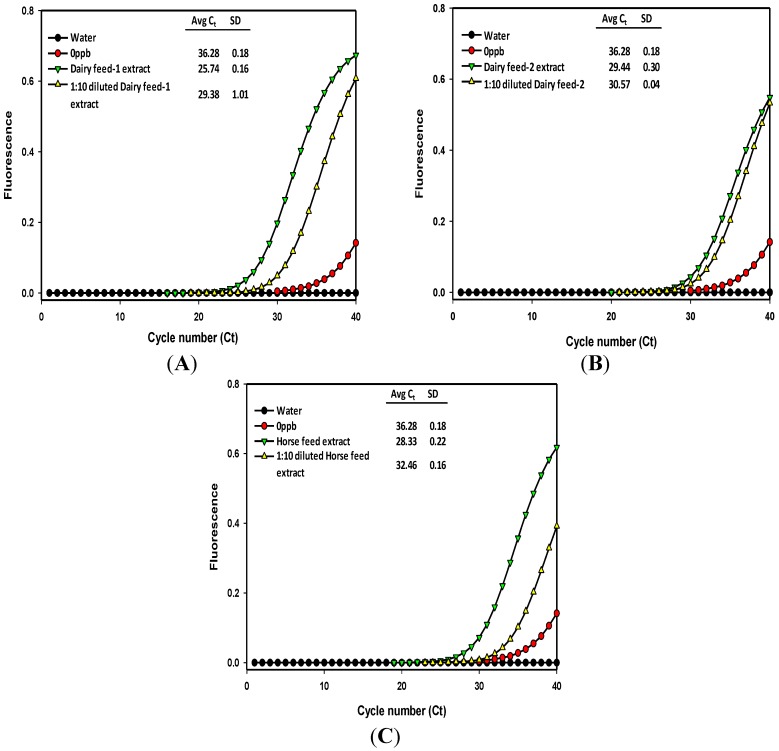
Figure 2.
Comparison of immuno-PCR fluorescence signals obtained with dairy feed type 1 (A); dairy feed type 2 (B); and horse feed (C) extracts subjected to aflatoxin detection. Fluorescence signal curves were generated from the undiluted and 10-fold diluted methanol/water extracts. Legends indicate the average cycle threshold (Ct) number and standard deviation from the replicates.

