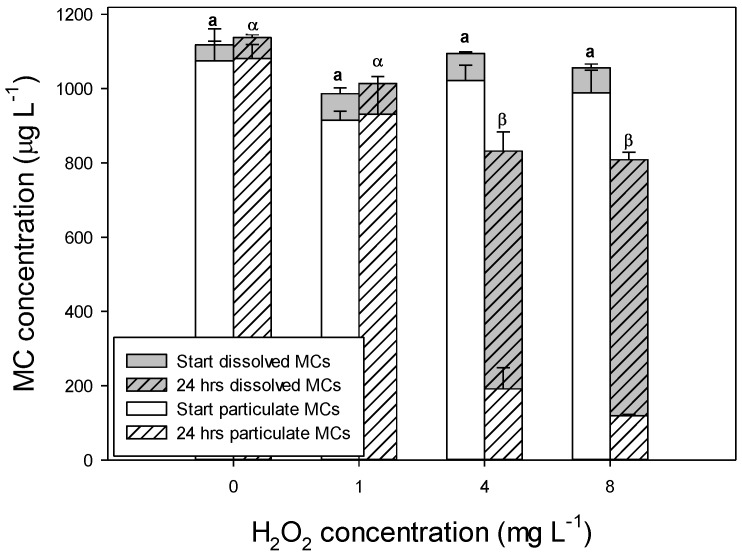
Figure 3.
Total particulate and dissolved microcystin (MC) concentrations (μg L−1) in Microcystis aeruginosa PCC 7820 at the start of the experiment (open bars) and after 24 h of exposure to different concentrations of hydrogen-peroxide (H2O2, in mg L−1; hatched bars). Error bars indicate 1 SD (n = 3). Similar symbols above the bars (a,α,β) indicate homogeneous groups of total MC concentrations that are not different at the p = 0.05 level (Holm–Sidak comparison).

