
Table 2. Equations Used in the Individual Efficiency Corrected Calculation Method.
|
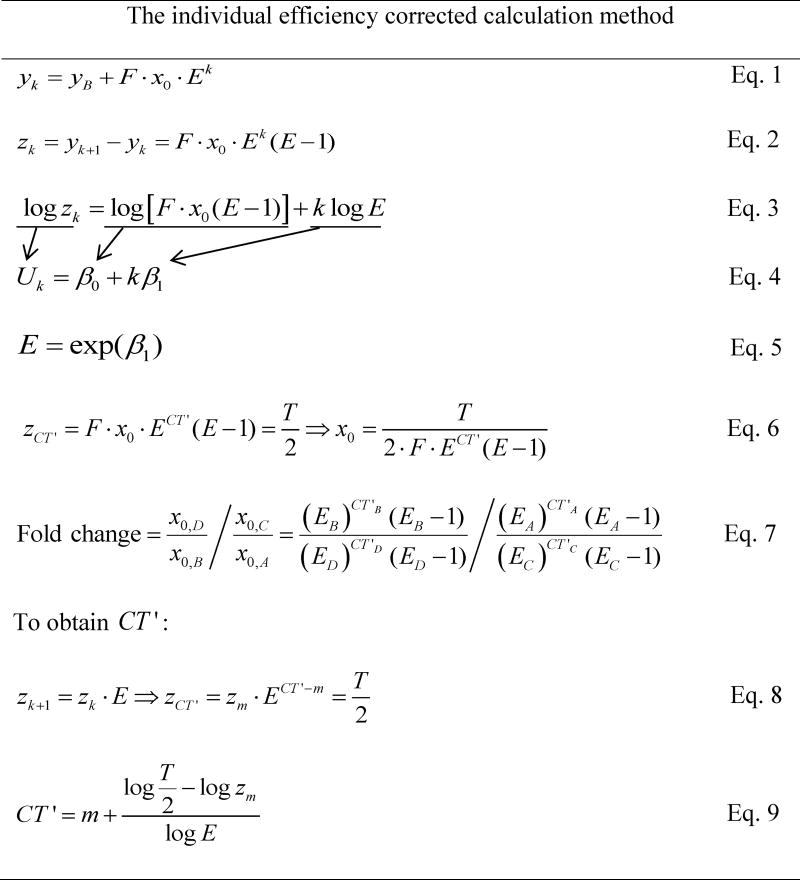
Note: Eq. 1 states that the observed fluorescence level after k cycles (yk) is the background fluorescence (yB) plus the initial DNA amount (x0) times the conversion factor F and Ek. F is the conversion factor between the number of target molecules and observed fluorescence, and E is 1 + amplification efficiency. Eq. 2 indicates that we take the difference in fluorescence for each of two consecutive cycles. After taking the natural logarithm on both sides of Eq. 2, we get Eq. 3. Then we apply linear regression in the form of Eq. 4 and calculate E using the estimated slope according to Eq. 5. Basically, equations 1–5 show the derivation of E. Thereafter, we plug the new threshold cycle (CT') into Eq. 2 and derive gene expression or starting DNA (x0) as indicated in Eq. 6. Fold change is computed by comparing the relative gene expression between target and reference samples (Eq. 7). The A, B, C, and D that are used to denote x0 refer to different experimental combinations described in Table 1. Eqs. 8–9 are employed to obtain CT'. Eq. 8 is derived from Eq. 2, and the new threshold is set to be half of the threshold (T). Here, m is the integer cycle right before CT', therefore, its corresponding fluorescence value (zm) is smaller than the new threshold (T/2). Thus, CT' can be obtained (Eq. 9).