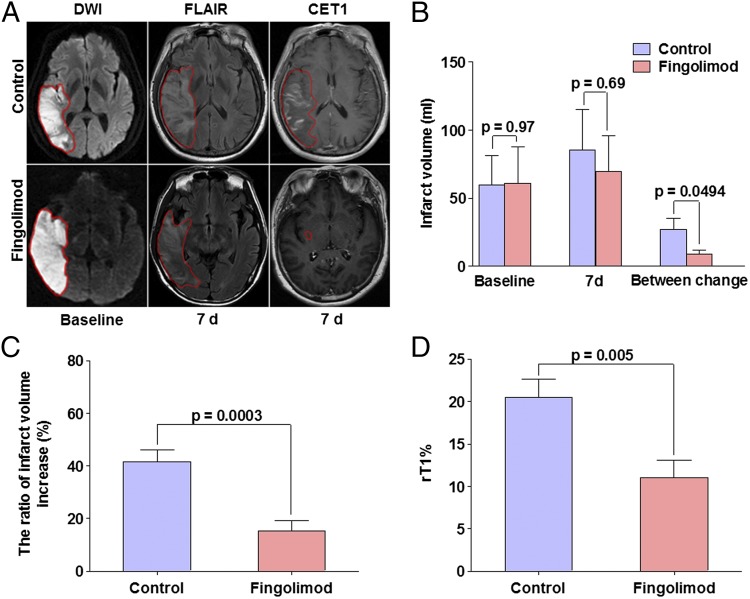
Fig. 4.
Impact of fingolimod on lesion volumes and vascular permeability in patients and representative MRIs. (A) Representative MRI scans showed an acute right hemisphere infarct in control (Upper) and a fingolimod-treated patient (Lower). At day 7, striking differences were evident in that the infarct volume enlarged in the control patient, and signal intensity was relatively high in FLAIR. In contrast, the infarct volume progress was restrained in our fingolimod-treated patient. Contrast-enhancement T1 images demonstrated prominent contrast in control patient at day 7, largely consistent with infarct volume. Margins of lesion for both patients are marked with lines. (B) Lesion volumes were measured on DWI (base line) and FLAIR (7 d). (C) The ratio of infarct volume increase = infarct volume change from baseline to day 7/infarct volume at baseline. (D) Vascular permeability (Lower) compared in two groups. Microvascular permeability of the infarct lesion were evaluated on CET-WI (7 d), the degree of enhancement on CET-WI was expressed as rT1%, rT1% = (mean signal intensity of a region of the infarction-mean signal intensity of the contra lateral homologous normal brain area)/mean signal intensity of the contra lateral homologous normal brain area. Values are mean ± SE; comparisons were performed with independent t test.

