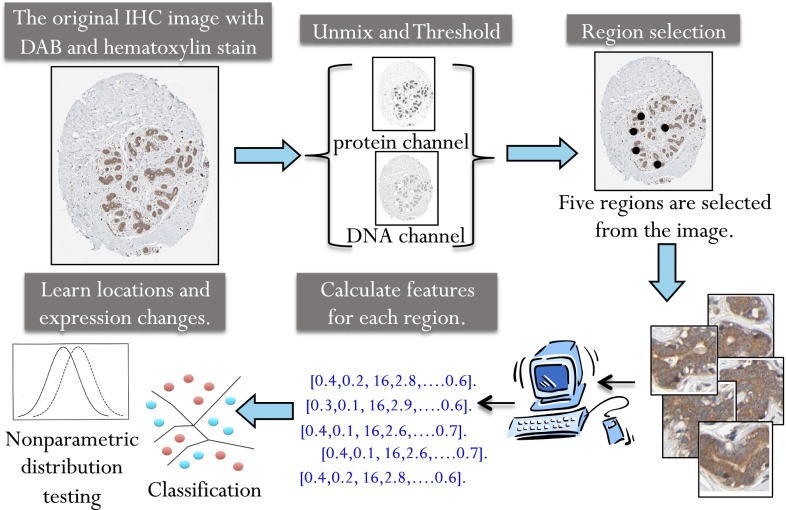
Fig. 1.
Overview of the location biomarker discovery pipeline. Images with strong or moderate antibody staining were selected. Linear unmixing was used to separate each image into two composite images representing the DNA and protein stains as previously described (11). Regions were selected by convolving the protein image with a low-pass filter and selecting the highest points as region centers. Fifty-seven numerical features were calculated to describe the pattern in each region. The nonparametric FR test was used to calculate a P value and determine whether the null hypothesis, that the features from the normal and cancer image come from the same distribution, should be rejected. The nonparametric Wald–Wolfowitz test was used to calculate a P value to measure how likely the two sets of images are to come from the same expression distribution. A nearest neighbor classifier was also used to determine the ability of each antibody to distinguish normal and cancer images.

