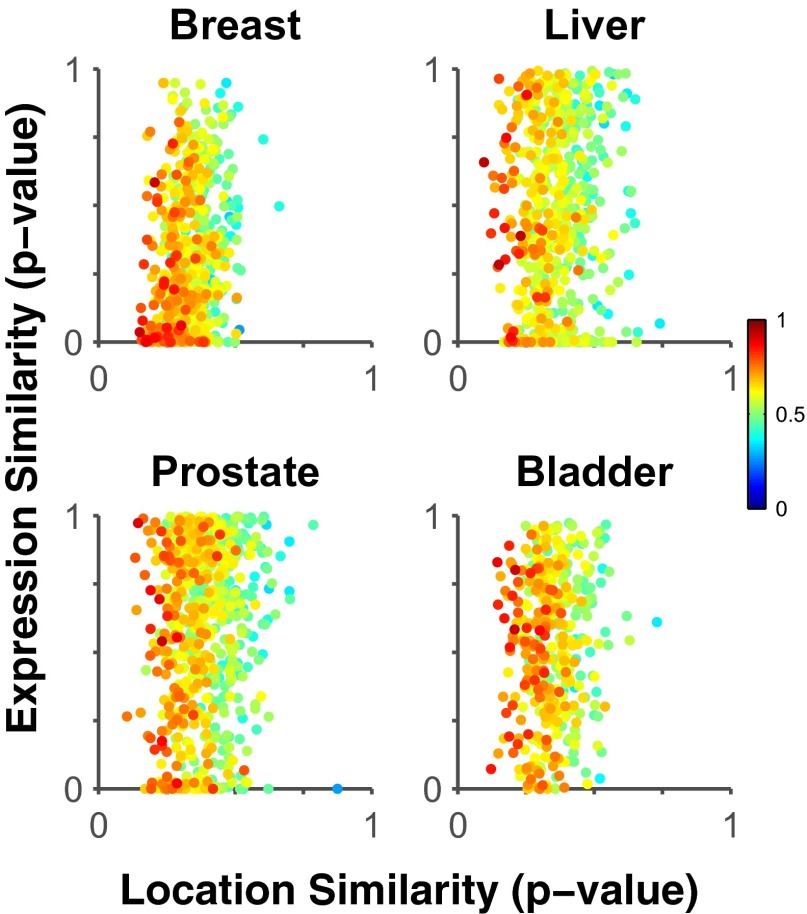
Fig. 2.
Distinguishing between intensity and location changes. Each dot shows the P values for the hypotheses that location or expression are different between normal and tumor tissue for a given protein. The correlation between location and expression P values is weak, suggesting that proteins that change location in the cancer state do not necessarily change expression, as seen in the top left corner. The color indicates the classification accuracy for separating normal and cancer images of that protein by using subcellular location information alone. Proteins with high classification accuracy for distinguishing normal and cancer images are represented by a red dot. Red proteins closest to the top left corner are potential location biomarkers, and their discovery would have been missed by traditional experiments that measure changes in protein expression.

