
Fig. 6.
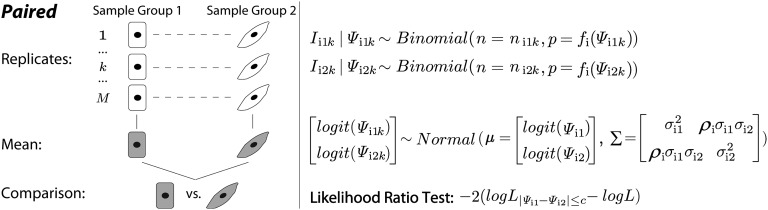
The statistical framework of the paired rMATS model. Each replicate in sample group 1 is paired with another replicate in sample group 2. For exon and the replicate, the total RNA-Seq read counts for the exon inclusion and skipping isoforms are denoted as for sample groups 1 and 2, respectively. The read counts for the exon inclusion isoform are denoted as . The exon inclusion levels are denoted as . The proportion of the read count from the exon inclusion isoform is adjusted by a normalization function that considers the lengths of the exon inclusion and skipping isoforms. rMATS uses a bivariate normal distribution to model the variation among replicates within sample group and the correlation between paired replicates. The mean and variance of exon inclusion levels in the two sample groups are denoted as and . The correlation parameter is denoted as .