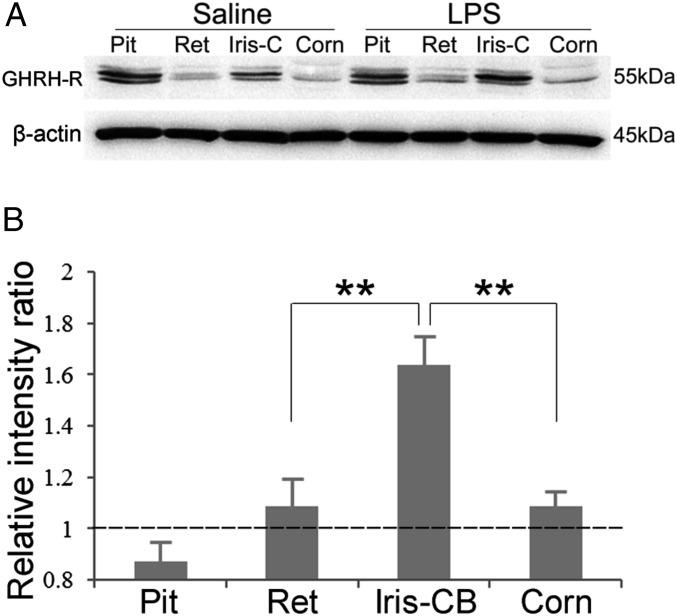
Fig. 2.
Western blot analysis of GHRH-R expression in pituitary and ocular tissues after LPS treatment. (A) GHRH-R protein was detected in the pituitary, retina, iris and ciliary body (iris-C), and cornea in normal and LPS-treated rats. Intensities of the bands corresponding to GHRH-R were normalized to that of the internal control, β-actin. (B) The relative intensity ratios were obtained from the normalized intensity values in LPS-treated rats over the corresponding values in controls. Increased GHRH-R expression was most obvious in iris and ciliary body (iris-CB). Data are shown as mean ± SEM; **P < 0.05 compared with the value in the pituitary; Mann–Whitney test; n = 3.

