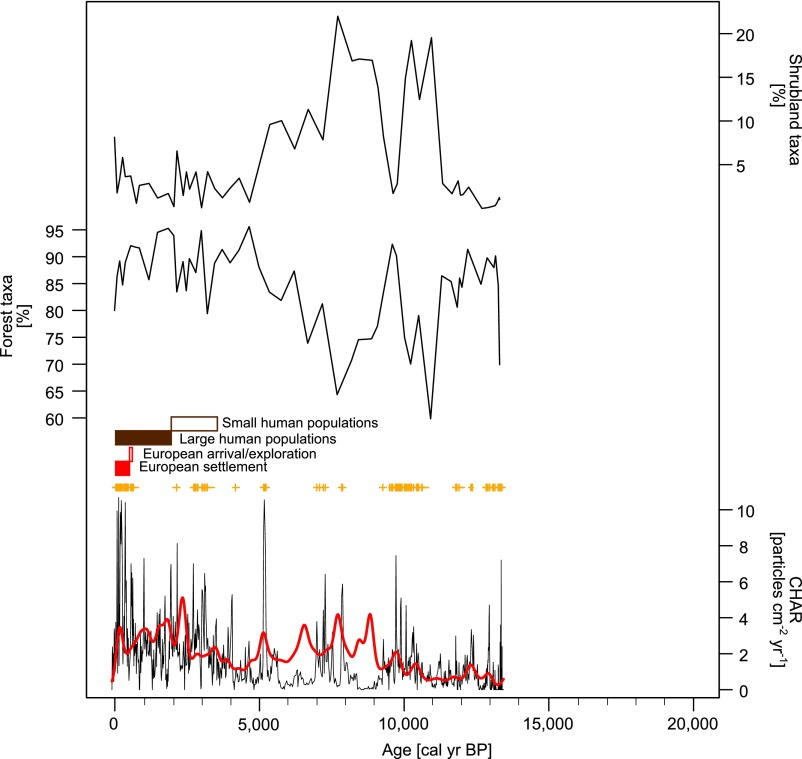
Fig. 4.
Pollen percentages of forest taxa and CHAR time series for L. Huala Hué. Expected CHAR values for each site based on the GAM fitted to the charcoal data are provided for reference (in red). Watershed-scale anomalies in biomass burning as inferred from outliers in the residuals of the CHAR model are indicated with a “+”. Positive anomalies represent periods of higher local biomass activity than the estimated regional trend. Inferred human population densities near the watershed are also shown.

