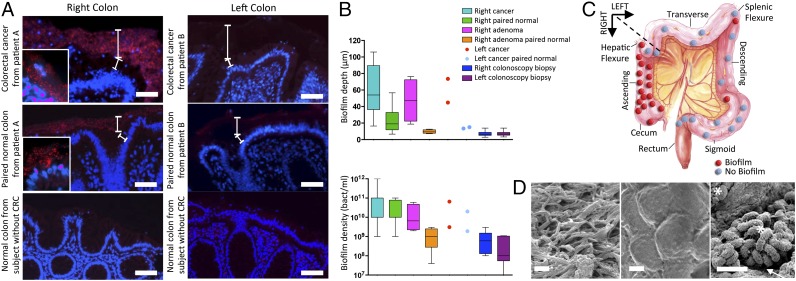
Fig. 1.
Detection and quantification of bacterial biofilms on colon tumors. (A) FISH of all bacteria (red) on cancers (Top), paired normal tissue from patients with CRC (Middle), and colonoscopy biopsies from healthy individuals without CRC (Bottom). All were counterstained with the nuclear stain, DAPI (blue). The top white brackets demarcate the mucus layer and the bottom white brackets denote the cytoplasm separating the nucleus (blue) of the colorectal epithelium from the mucus layer. PAS stains (SI Appendix, Fig. S2) further delineate the mucus layer on these samples. (Insets) Closeup (100×) showing close contact between bacteria and epithelial cells in patient A. The pale, nonpunctate red staining of the mucus layer in patients without biofilms (patient B) represents nonspecific binding to the mucus layer, which is easily demarcated from the bright red punctate staining of the bacteria infiltrating the mucus layer in patients with biofilms. (Scale bars, 50 µm.) (B) Biofilm depth and density measurements from right CRCs/surgical normal pairs (n = 15), right adenomas/surgical normal pairs (n = 4), left CRCs/surgical normal pairs (n = 15), left adenomas/surgical normal pairs (n = 2), and right/left paired normal colonoscopy biopsies from healthy individuals without CRC (n = 60). Data displayed as bar and whisker graphs, where line designates the median, boxes the 25/75th percentile, and whiskers the 95th percentile. (C) Geographical distribution of tumors (CRC, n = 30, and adenomas, n = 6) with biofilm designation. (D) SEM images. (Left) Biofilm on a right colon cancer dominated by filamentous bacteria. (Center) Biofilm-negative left colon cancer where no bacteria are visualized. (Right) Image of bacterial contact with host epithelium (white arrow) on biofilm-covered right colon adenoma. Mixed bacterial morphology (*rods and cocci) is seen. (Scale bars, 2 µm.)

