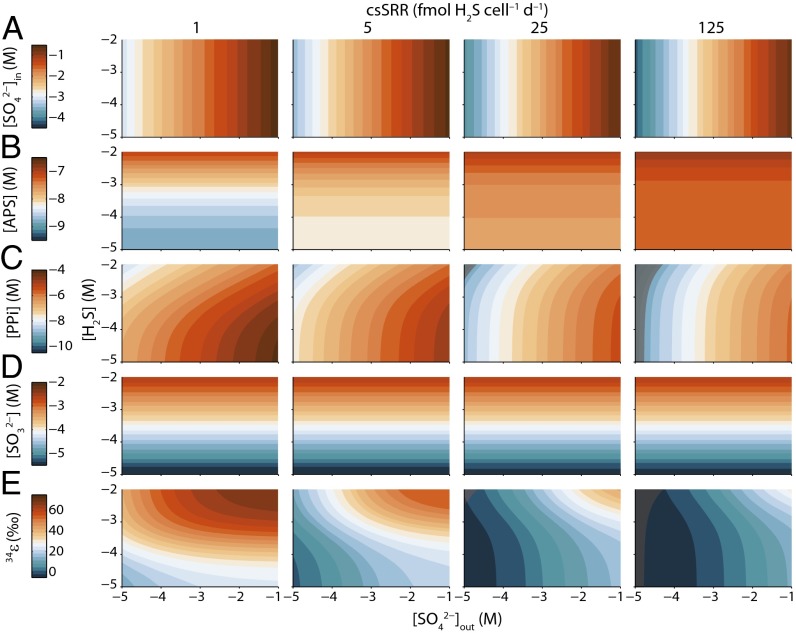
Fig. 2.
Predicted metabolite concentrations and isotopic fractionation in a model sulfate reducer. Shown are intracellular concentrations of sulfate (, row A), APS ([APS], row B), PPi ([PPi], row C), and sulfite (, row D) and the net isotopic fractionation between the substrate sulfate and product sulfide (, row E) as functions of extracellular sulfate (, horizontal axis) and sulfide concentrations ([H2S], vertical axis). All concentrations are shown on logarithmic scales. Intracellular metabolite levels are calculated from Eqs. S22–S25, whereas isotopic fractionation is calculated by application of Eqs. 2 and 5. Regions where calculated PPi concentrations (and associated fractionations) are physiologically unlikely are shown as gray shaded fields (SI Materials and Methods) (rows C and E).

